

Suppose that you have in your possession bivariate data giving birthrate and life expectancy information for...
Fantastic news! We've Found the answer you've been seeking!
Question:

Transcribed Image Text:
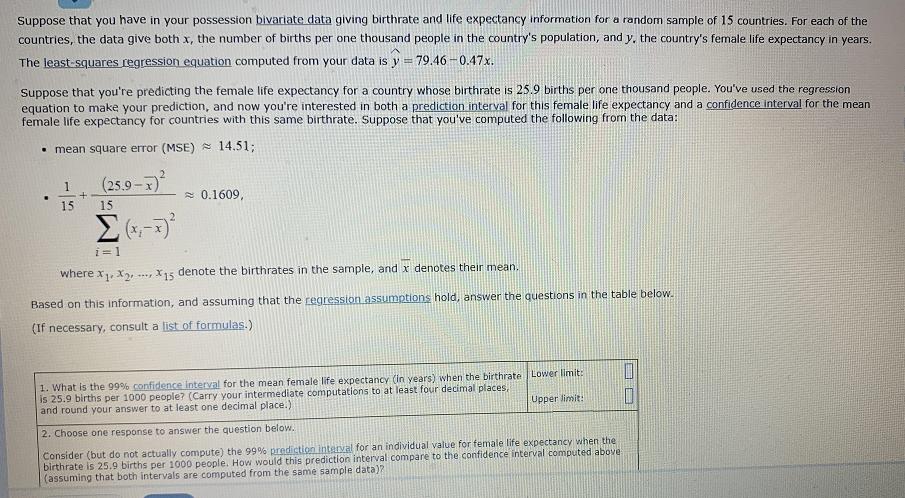
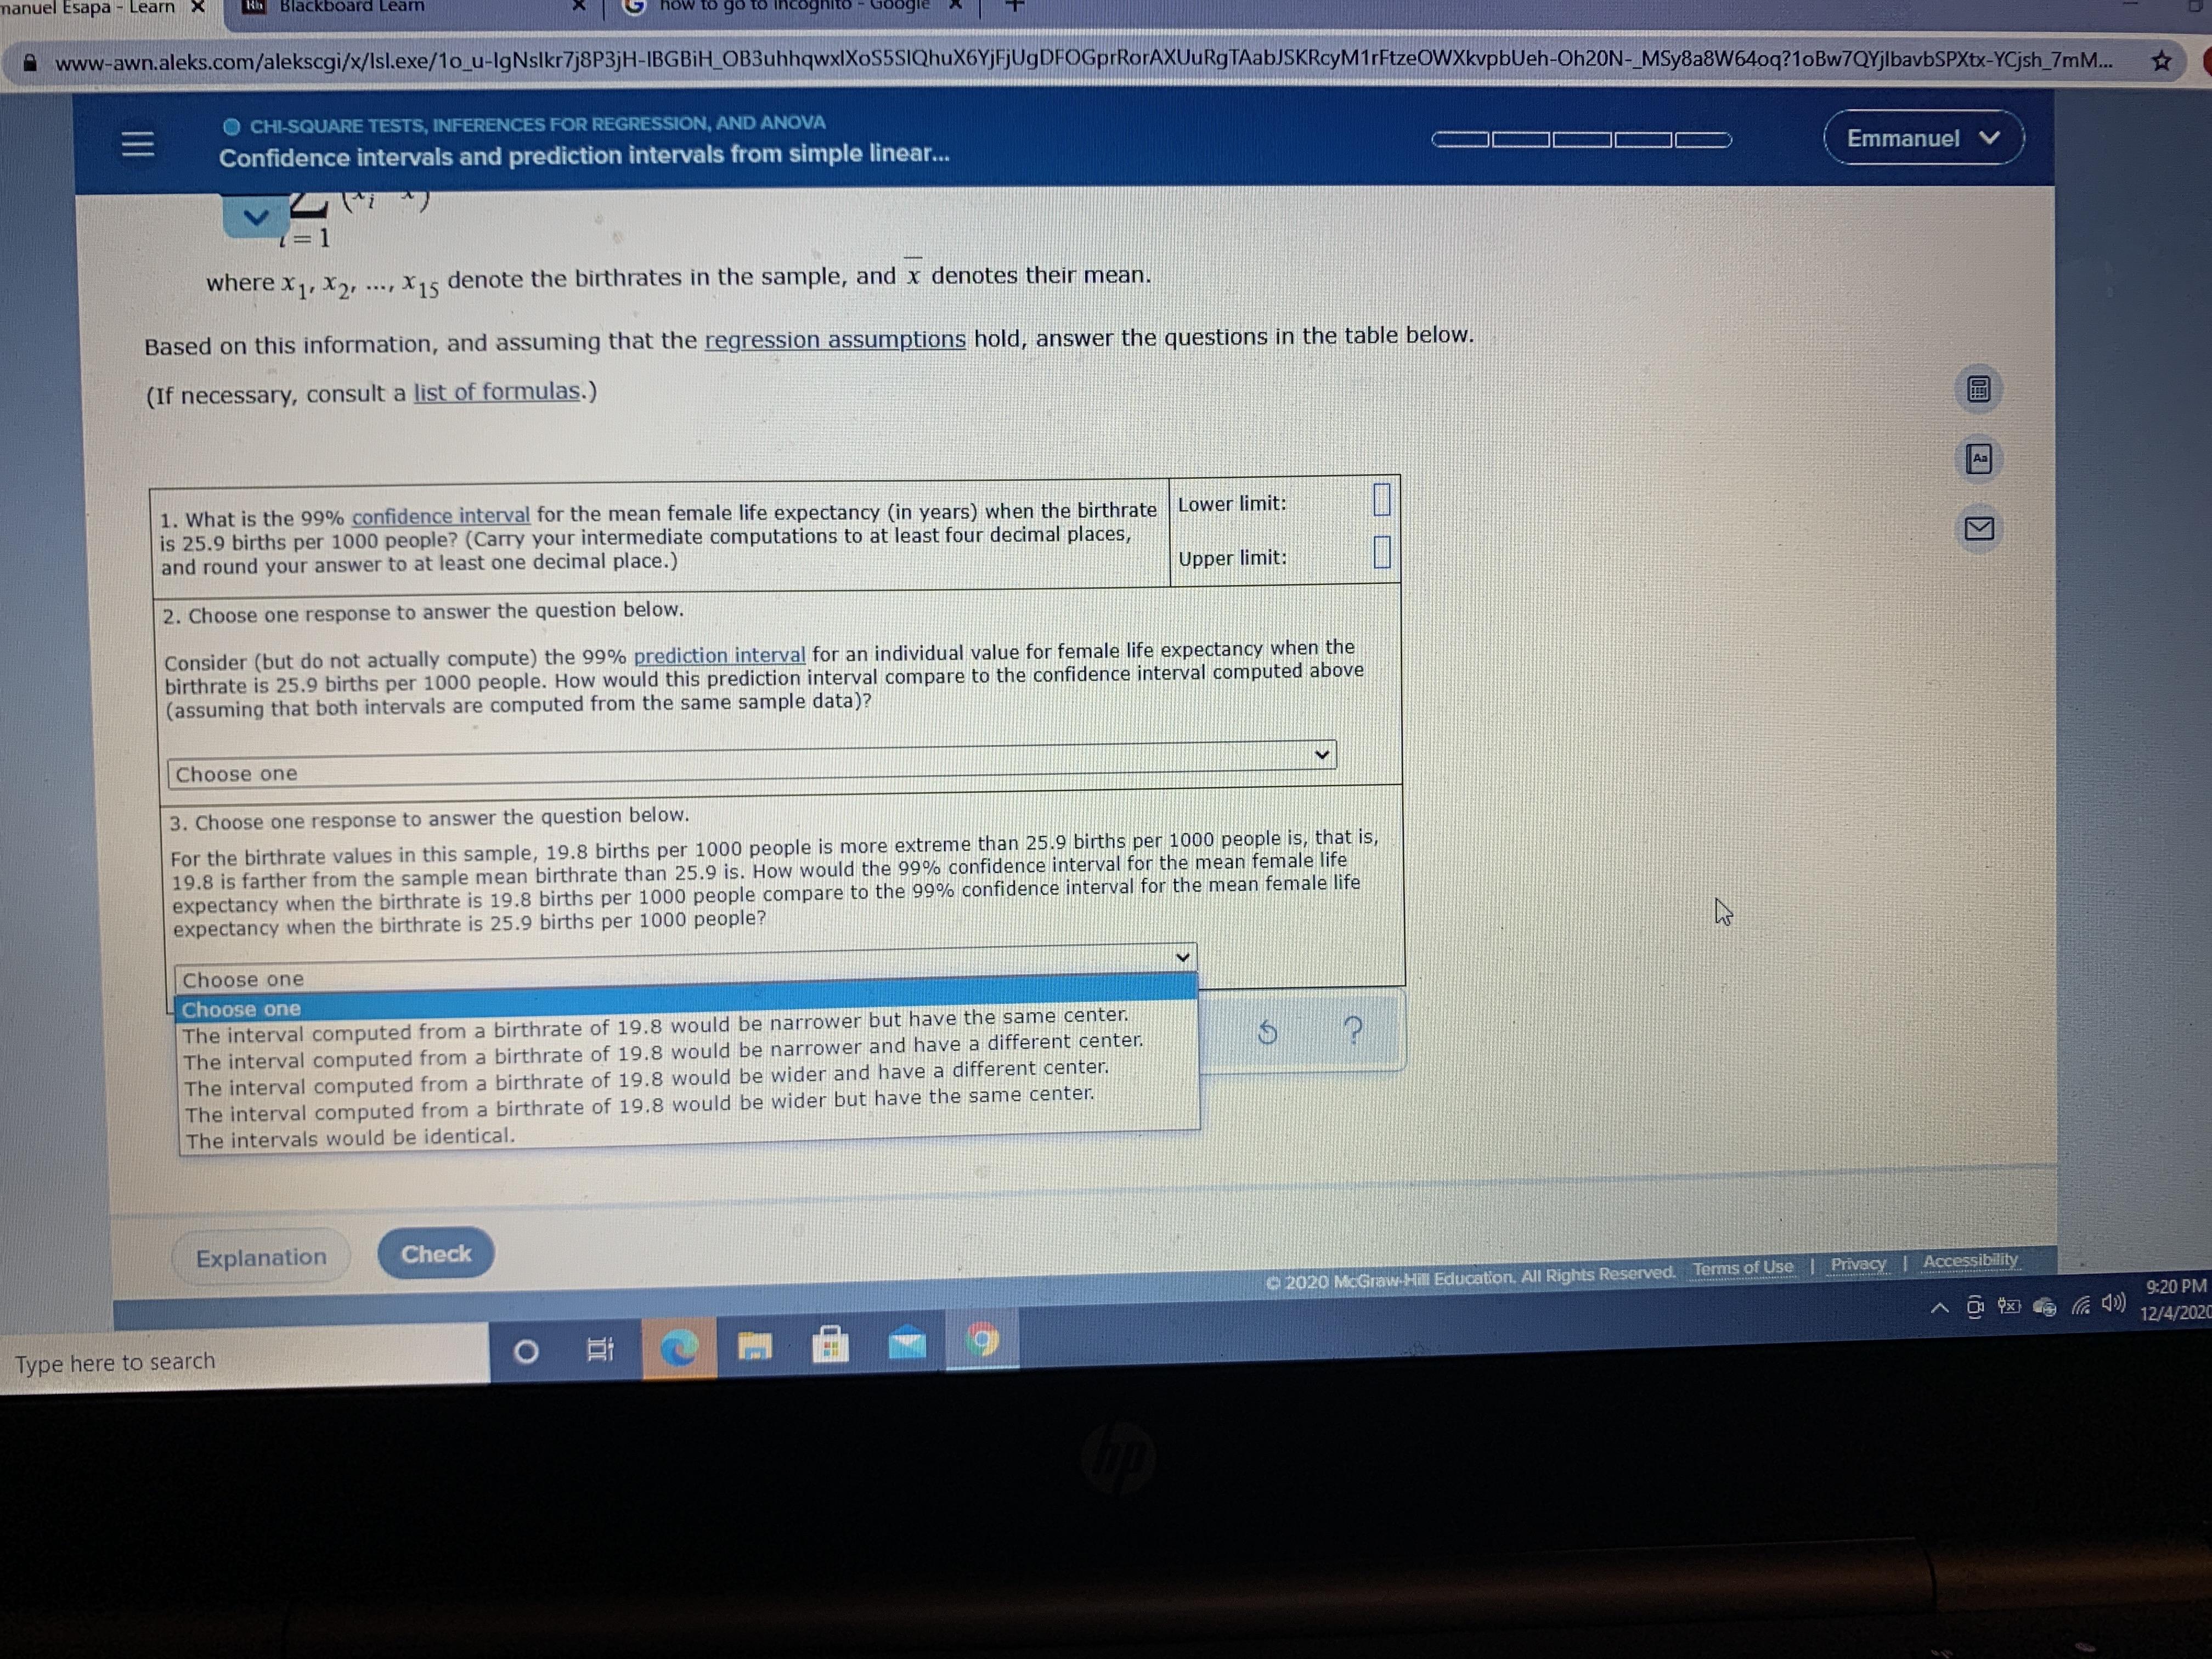
Suppose that you have in your possession bivariate data giving birthrate and life expectancy information for a random sample of 15 countries. For each of the countries, the data give both x, the number of births per one thousand people in the country's population, and y, the country's female life expectancy in years. The least-squares regression equation computed from your data is y = 79.46 -0.47x. %3! Suppose that you're predicting the female life expectancy for a country whose birthrate is 25.9 births per one thousand people. You've used the regression equation to make your prediction, and now you're interested in both a prediction interval for this female life expectancy and a confidence interval for the mean female life expectancy for countries with this same birthrate. Suppose that you've computed the following from the data: • mean square error (MSE) = 14.51; (25.9 -) 2 0.1609, 15 15 i=1 where x, X, , X15 denote the birthrates in the sample, and x denotes their mean. Based on this information, and assuming that the regression assumptions hold, answer the questions in the table below. (If necessary, consult a list of formulas.) 1. What is the 99% confidence interval for the mean female life expectancy (in years) when the birthrate Lower limit: is 25.9 births per 1000 people? (Carry your intermediate computations to at least four decimal places, and round your answer to at least one decimal place.) Upper limit: 2. Choose one response to answer the question below. Consider (but do not actually compute) the 99% prediction interval for an individual value for female life expectancy when the birthrate is 25.9 births per 1000 people. How would this prediction interval compare to the confidence interval computed above (assuming that both intervals are computed from the same sample data)? nuel Esapa - Learn X Nh Blackboard Learn how to go to incognito - Google X www-awn.aleks.com/alekscgi/x/Isl.exe/1o_u-IgNslkr7j8P3jH-IBGBİH_OB3uhhqwxIXoS5SIQhuX6YjFjUgDFOGprRorAXUuRgTAabJSKRcyM1rFtzeOWXkvpbUeh-Oh20N-_MSy8a8W64oq?1oBw7QYjlbavbSPXtx-YCjsh_7mM.. CHI-SQUARE TESTS, INFERENCES FOR REGRESSION, AND ANOVA Emmanuel V Confidence intervals and prediction intervals from simple linear... where x,, x, .., x15 denote the birthrates in the sample, and x denotes their mean. Based on this information, and assuming that the regression assumptions hold, answer the questions in the table below. (If necessary, consult a list of formulas.) Aa 1. What is the 99% confidence interval for the mean female life expectancy (in years) when the birthrate Lower limit: is 25.9 births per 1000 people? (Carry your intermediate computations to at least four decimal places, and round your answer to at least one decimal place.) Upper limit: 2. Choose one response to answer the question below. Consider (but do not actually compute) the 99% prediction interval for an individual value for female life expectancy when the birthrate is 25.9 births per 1000 people. How would this prediction interval compare to the confidence interval computed above (assuming that both intervals are computed from the same sample data)? Choose one Choose one The prediction interval would be identical to the confidence interval. The prediction interval would be positioned to the left of the confidence interval. The prediction interval would have the same center as, but would be narrower than, the confidence interval. The prediction interval would be positioned to the right of the confidence interval. The prediction interval would have the same center as, but would be wider than, the confidence interval. at is, ife Choose one Check Accessibility Explanation O 2020 McGraw-Hill Education. All Rights Reserved. Terms of Use | Privacy 9:20 PM 12/4/2020 Type here to search II manuel Esapa - Learn X Blackboard Learm how to go to incognito - Google A www-awn.aleks.com/alekscgi/x/lsl.exe/1o_u-IgNslkr7j8P3jH-IBGBIH_OB3uhhqwxlXoS5SIQhuX6YjFjUgDFOGprRorAXUuRgTAabJSKRcyM1rFtzeOWXkvpbUeh-Oh20N-_MSy8a8W64oq?1oBw7QYjlbavbSPXtx-YCjsh_7mM.. O CHI-SQUARE TESTS, INFERENCES FOR REGRESSION, AND ANOVA Emmanuel V Confidence intervals and prediction intervals from simple linear... (3D1 =D1 where x,, x,, ..., X15 denote the birthrates in the sample, and x denotes their mean. Based on this information, and assuming that the regression assumptions hold, answer the questions in the table below. (If necessary, consult a list of formulas.) Aa 1. What is the 99% confidence interval for the mean female life expectancy (in years) when the birthrate Lower limit: is 25.9 births per 1000 people? (Carry your intermediate computations to at least four decimal places, and round your answer to at least one decimal place.) Upper limit: 2. Choose one response to answer the question below. Consider (but do not actually compute) the 99% prediction interval for an individual value for female life expectancy when the birthrate is 25.9 births per 1000 people. How would this prediction interval compare to the confidence interval computed above (assuming that both intervals are computed from the same sample data)? Choose one 3. Choose one response to answer the question below. For the birthrate values in this sample, 19.8 births per 1000 people is more extreme than 25.9 births per 1000 people is, that is, 19.8 is farther from the sample mean birthrate than 25.9 is. How would the 99% confidence interval for the mean female life expectancy when the birthrate is 19.8 births per 1000 people compare to the 99% confidence interval for the mean fenmale life expectancy when the birthrate is 25.9 births per 1000 people? Choose one Choose one The interval computed from a birthrate of 19.8 would be narrower but have the same center. The interval computed from a birthrate of 19.8 would be narrower and have a different center. The interval computed from a birthrate of 19.8 would be wider and have a different center. The interval computed from a birthrate of 19.8 would be wider but have the same center. The intervals would be identical. Explanation Check 2020 McGraw-Hill Educantion, All Rightts Reserved. Terms of Use Privacy | Accessibility ヘ 図 9:20 PM 12/4/2020 6. Type here to search Suppose that you have in your possession bivariate data giving birthrate and life expectancy information for a random sample of 15 countries. For each of the countries, the data give both x, the number of births per one thousand people in the country's population, and y, the country's female life expectancy in years. The least-squares regression equation computed from your data is y = 79.46 -0.47x. %3! Suppose that you're predicting the female life expectancy for a country whose birthrate is 25.9 births per one thousand people. You've used the regression equation to make your prediction, and now you're interested in both a prediction interval for this female life expectancy and a confidence interval for the mean female life expectancy for countries with this same birthrate. Suppose that you've computed the following from the data: • mean square error (MSE) = 14.51; (25.9 -) 2 0.1609, 15 15 i=1 where x, X, , X15 denote the birthrates in the sample, and x denotes their mean. Based on this information, and assuming that the regression assumptions hold, answer the questions in the table below. (If necessary, consult a list of formulas.) 1. What is the 99% confidence interval for the mean female life expectancy (in years) when the birthrate Lower limit: is 25.9 births per 1000 people? (Carry your intermediate computations to at least four decimal places, and round your answer to at least one decimal place.) Upper limit: 2. Choose one response to answer the question below. Consider (but do not actually compute) the 99% prediction interval for an individual value for female life expectancy when the birthrate is 25.9 births per 1000 people. How would this prediction interval compare to the confidence interval computed above (assuming that both intervals are computed from the same sample data)? nuel Esapa - Learn X Nh Blackboard Learn how to go to incognito - Google X www-awn.aleks.com/alekscgi/x/Isl.exe/1o_u-IgNslkr7j8P3jH-IBGBİH_OB3uhhqwxIXoS5SIQhuX6YjFjUgDFOGprRorAXUuRgTAabJSKRcyM1rFtzeOWXkvpbUeh-Oh20N-_MSy8a8W64oq?1oBw7QYjlbavbSPXtx-YCjsh_7mM.. CHI-SQUARE TESTS, INFERENCES FOR REGRESSION, AND ANOVA Emmanuel V Confidence intervals and prediction intervals from simple linear... where x,, x, .., x15 denote the birthrates in the sample, and x denotes their mean. Based on this information, and assuming that the regression assumptions hold, answer the questions in the table below. (If necessary, consult a list of formulas.) Aa 1. What is the 99% confidence interval for the mean female life expectancy (in years) when the birthrate Lower limit: is 25.9 births per 1000 people? (Carry your intermediate computations to at least four decimal places, and round your answer to at least one decimal place.) Upper limit: 2. Choose one response to answer the question below. Consider (but do not actually compute) the 99% prediction interval for an individual value for female life expectancy when the birthrate is 25.9 births per 1000 people. How would this prediction interval compare to the confidence interval computed above (assuming that both intervals are computed from the same sample data)? Choose one Choose one The prediction interval would be identical to the confidence interval. The prediction interval would be positioned to the left of the confidence interval. The prediction interval would have the same center as, but would be narrower than, the confidence interval. The prediction interval would be positioned to the right of the confidence interval. The prediction interval would have the same center as, but would be wider than, the confidence interval. at is, ife Choose one Check Accessibility Explanation O 2020 McGraw-Hill Education. All Rights Reserved. Terms of Use | Privacy 9:20 PM 12/4/2020 Type here to search II manuel Esapa - Learn X Blackboard Learm how to go to incognito - Google A www-awn.aleks.com/alekscgi/x/lsl.exe/1o_u-IgNslkr7j8P3jH-IBGBIH_OB3uhhqwxlXoS5SIQhuX6YjFjUgDFOGprRorAXUuRgTAabJSKRcyM1rFtzeOWXkvpbUeh-Oh20N-_MSy8a8W64oq?1oBw7QYjlbavbSPXtx-YCjsh_7mM.. O CHI-SQUARE TESTS, INFERENCES FOR REGRESSION, AND ANOVA Emmanuel V Confidence intervals and prediction intervals from simple linear... (3D1 =D1 where x,, x,, ..., X15 denote the birthrates in the sample, and x denotes their mean. Based on this information, and assuming that the regression assumptions hold, answer the questions in the table below. (If necessary, consult a list of formulas.) Aa 1. What is the 99% confidence interval for the mean female life expectancy (in years) when the birthrate Lower limit: is 25.9 births per 1000 people? (Carry your intermediate computations to at least four decimal places, and round your answer to at least one decimal place.) Upper limit: 2. Choose one response to answer the question below. Consider (but do not actually compute) the 99% prediction interval for an individual value for female life expectancy when the birthrate is 25.9 births per 1000 people. How would this prediction interval compare to the confidence interval computed above (assuming that both intervals are computed from the same sample data)? Choose one 3. Choose one response to answer the question below. For the birthrate values in this sample, 19.8 births per 1000 people is more extreme than 25.9 births per 1000 people is, that is, 19.8 is farther from the sample mean birthrate than 25.9 is. How would the 99% confidence interval for the mean female life expectancy when the birthrate is 19.8 births per 1000 people compare to the 99% confidence interval for the mean fenmale life expectancy when the birthrate is 25.9 births per 1000 people? Choose one Choose one The interval computed from a birthrate of 19.8 would be narrower but have the same center. The interval computed from a birthrate of 19.8 would be narrower and have a different center. The interval computed from a birthrate of 19.8 would be wider and have a different center. The interval computed from a birthrate of 19.8 would be wider but have the same center. The intervals would be identical. Explanation Check 2020 McGraw-Hill Educantion, All Rightts Reserved. Terms of Use Privacy | Accessibility ヘ 図 9:20 PM 12/4/2020 6. Type here to search
Expert Answer:

Related Book For 

Business Statistics a decision making approach
ISBN: 978-0133021844
9th edition
Authors: David F. Groebner, Patrick W. Shannon, Phillip C. Fry
Posted Date:
Students also viewed these mathematics questions
-
Each member of a random sample of 15 business economists was asked to predict the rate of inflation for the coming year. Assume that the predictions for the whole population of business economists...
-
The Patients file contains information for a random sample of geriatric patients. During a meeting, one hospital administrator indicated that 70% of the geriatric patients are males. a. Based on the...
-
A random sample of 15 college students were asked "How many hours per week typically do you work outside the 13 home?" Their responses are shown on the right. 30 12 7 19 Determine the shape of the...
-
Smart Price Company, a producer of black forest cakes, has budgeted sales and production (in units) for the last quarter in 2019 to be as follows: Sales Production October November 26,000 28,000...
-
What is your personal entrepreneurial strategy? How should it change?
-
Of the three models of prosecuting cases-horizontal model, vertical model, and mixed modelwhich do you think would be most appropriate for the prosecutor's office where you attend school?
-
Repeat Problem 8.52 for a circular tube of diameter \(D=2 \mathrm{~mm}\), an applied heat flux of \(q^{\prime \prime}=200,000 \mathrm{~W} / \mathrm{m}^{2}\), and a mass flow rate of \(\dot{m}=10...
-
At the end of February, Howard Productions accounting records reveal a balance for cash equal to $19,225. However, the balance of cash in the bank at the end of February is only $735. Howard is...
-
Identify a personal economic decision that was driven by a behavioral bias rather than by pure rational behavior. Given your understanding of behavioral economics, how would your decision differ...
-
Dippin Donuts has six bakers and a bakery supervisor on each of its two shifts. Bakers working from 8am 5pm (with a 1-hour break) are paid $6.00 per hour. Bakers working the 10pm-7am shift (with a...
-
Find the value of R, in terms of R and then find the value of R that makes the maximum power delivered to the load 3mW. 1V 2V R R www R 3V 11, RL
-
Neliphen Hitech Ltd. is a large-scale private-sector manufacturing company that has been running with a huge profit for the past 13 years. It has an exceptionally good sales force and marketing...
-
Which of these is the process of putting the right persons in the right job? Internal recruitment External recruitment Selection Placement
-
Directing is a complex management function since it requires the manager to understand the motives, needs, and attitudes of their subordinates. True False
-
Recruitment involves less time and money as compared to selection. True False
-
Can an organization function without control? Comment.
-
A company produces 3000 memory cards each day. Every day 25 are randomly selected for testing. One day, 1 of those tested failed. About how many of the memory cards produced that day are likely to...
-
An annual report of The Campbell Soup Company reported on its income statement $2.4 million as equity in earnings of affiliates. Journalize the entry that Campbell would have made to record this...
-
A European cereal maker recently sampled 20 of its medium-size oat cereal packages to determine the weights of the cereal in each package. These sample data, measured in ounces, are as follows:...
-
At State University, a study was done to establish whether a relationship exists between students graduating grade point average (GPA) and the SAT verbal score when the student originally entered the...
-
The consumer price index (CPI) is a measure of the average change in prices over time in a fixed market basket of goods and services typically purchased by consumers. The CPI for all urban consumers...
-
The following figures relate to the production of product X: If the years production is 20,000 units and this product uses 25 per cent of total factory production, the unit cost for product X in...
-
Are depreciation expenses either too subjective or too arbitrary to provide useful information?
-
A company buys and sells units of product P as follows: Under a FIFO method, the gross profit on the sold item is: A. :20. B. :24. C. :25. D. :30. 1 January buy 2 at 30 1 February 1 March buy 3 at 40...

Study smarter with the SolutionInn App