

Question: Suppose that you use the three average returns per annum calculated in above as the estimates of the expected returns for the two stocks and
Suppose that you use the three average returns per annum calculated in above as the estimates of the expected returns for the two stocks and market portfolio, respectively. Suppose that the risk-free rate is 0.8% per annum.
Plot a risk-return graph with beta on the x-axis and returns on the y-axis, which shows the Security Market Line, the market portfolio, and the actual returns of the two stocks.
Determine the fair expected returns for the two stocks according to CAPM
Discuss your findings
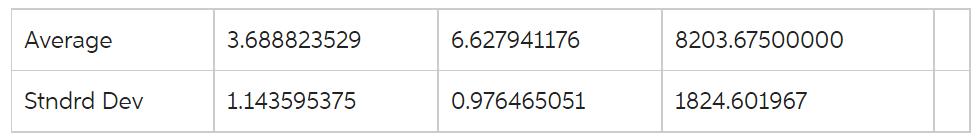
Average Stndrd Dev 3.688823529 1.143595375 6.627941176 0.976465051 8203.67500000 1824.601967
Step by Step Solution
3.44 Rating (160 Votes )
There are 3 Steps involved in it
The Security Market Line SML is a graphical representation of the Capital Asset Pricing Model CAPM I... View full answer

Get step-by-step solutions from verified subject matter experts