

Question: Suppose the analyst constructs an x - chart to see if the production process is in - control. What are the Lower and upper control
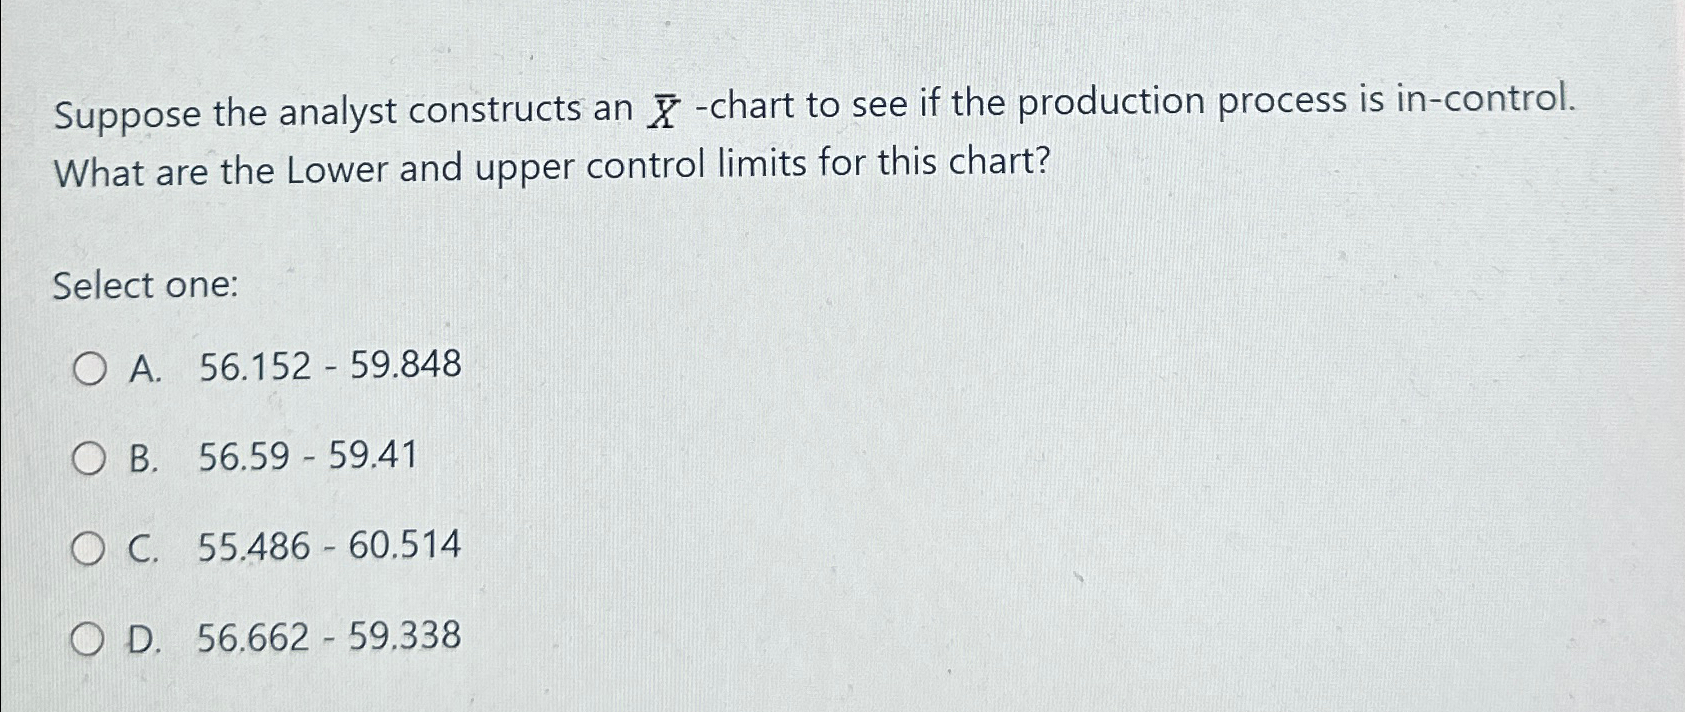
Suppose the analyst constructs an chart to see if the production process is incontrol. What are the Lower and upper control limits for this chart?
Select one:
A
B
C
D
Step by Step Solution
There are 3 Steps involved in it
1 Expert Approved Answer
Step: 1 Unlock

Question Has Been Solved by an Expert!
Get step-by-step solutions from verified subject matter experts
Step: 2 Unlock
Step: 3 Unlock