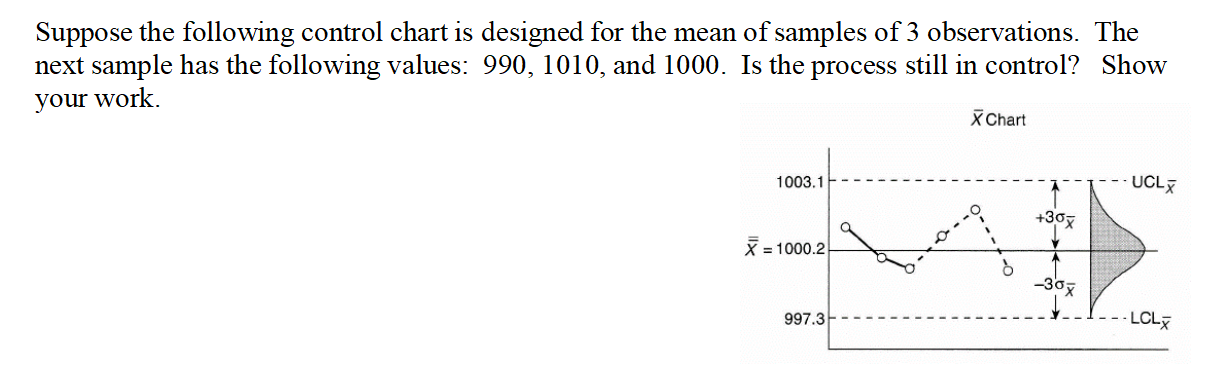
Question: Suppose the following control chart is designed for the mean of samples of 3 observations. The next sample has the following values: 990, 1010, and

Suppose the following control chart is designed

Suppose the following control chart is designed for the mean of samples of 3 observations. The next sample has the following values: 990, 1010, and 1000. Is the process still in control? Show your work. X Chart 1003.1 UCLX +30 X = 1000-2 -307 997.3H -LCL

Step by Step Solution

There are 3 Steps involved in it

1 Expert Approved Answer
Step: 1 Unlock blur-text-image
Question Has Been Solved by an Expert!

Get step-by-step solutions from verified subject matter experts

Step: 2 Unlock
Step: 3 Unlock

Students Have Also Explored These Related General Management Questions!