

Question: Suppose the following table was generated from the sample data of 20 teachers relating annual salary to months of teaching experience and gender. Coefficients Standard
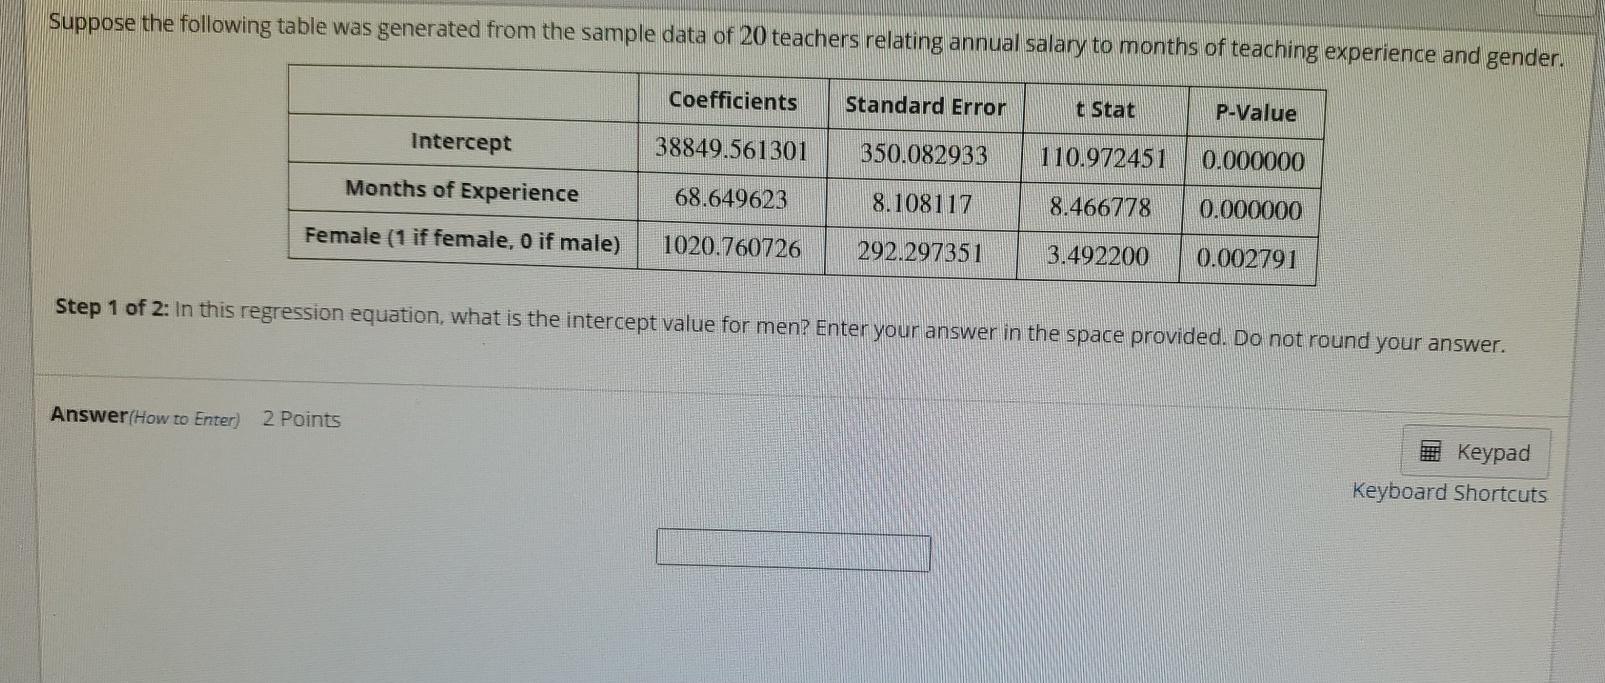
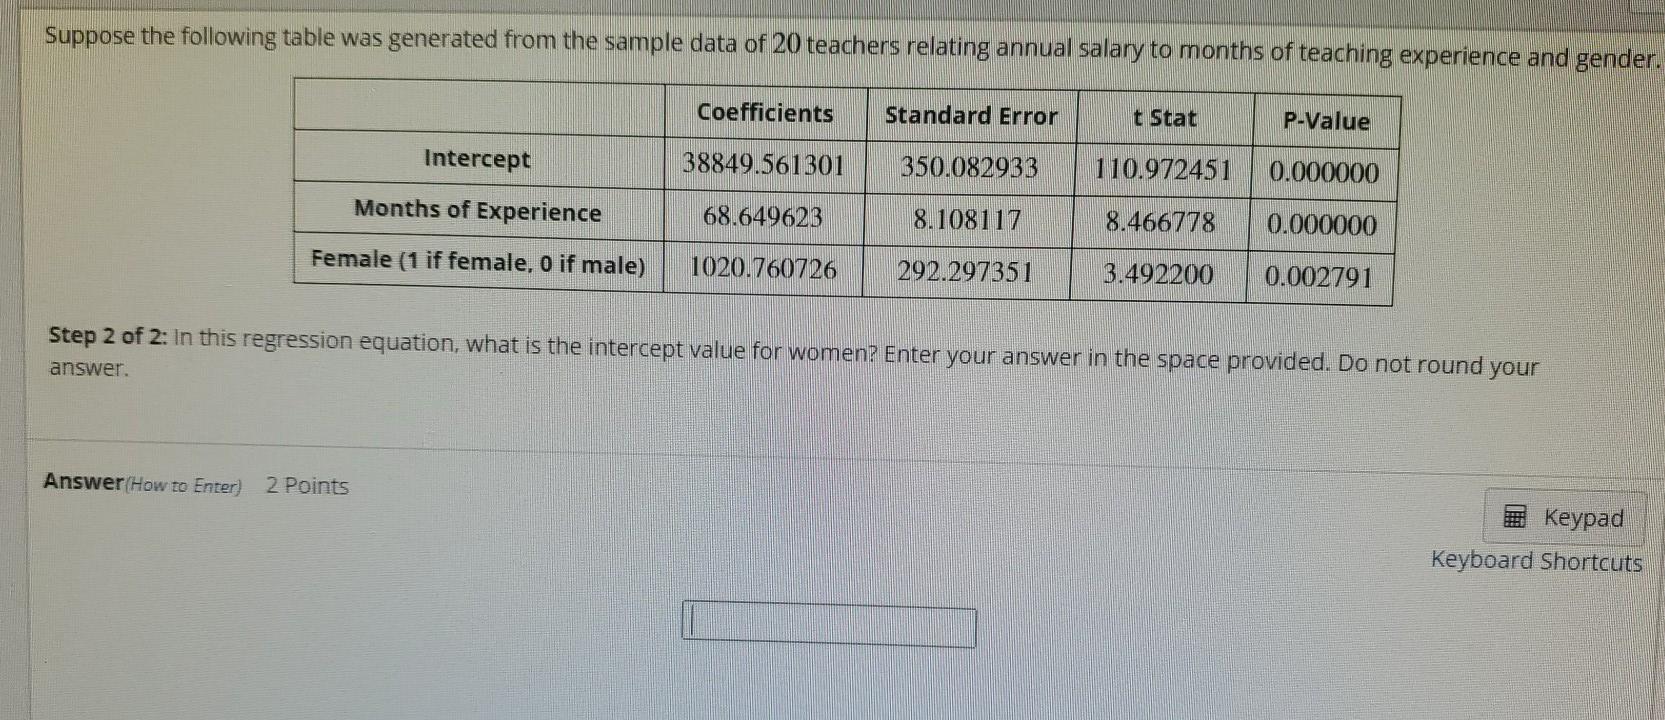
Suppose the following table was generated from the sample data of 20 teachers relating annual salary to months of teaching experience and gender. Coefficients Standard Error t Stat P-Value Intercept 38849.561301 350.082933 110.972451 0.000000 Months of Experience 68.649623 8.108117 8.466778 0.000000 Female (1 if female, o if male) 1020.760726 292.297351 3.492200 0.002791 Step 1 of 2: In this regression equation, what is the intercept value for men? Enter your answer in the space provided. Do not round your answer. Answer(How to Enter) 2 Points Keypad Keyboard Shortcuts Suppose the following table was generated from the sample data of 20 teachers relating annual salary to months of teaching experience and gender. Coefficients Standard Error t Stat P-Value Intercept 38849.561301 350.082933 110.972451 0.000000 Months of Experience 68.649623 8.108117 8.466778 0.000000 Female (1 if female, o if male) 1020.760726 292.297351 3.492200 0.002791 Step 2 of 2: In this regression equation, what is the intercept value for women? Enter your answer in the space provided. Do not round your answer. Answer(How to Enter) 2 Points Keypad Keyboard Shortcuts Suppose the following table was generated from the sample data of 20 teachers relating annual salary to months of teaching experience and gender. Coefficients Standard Error t Stat P-Value Intercept 38849.561301 350.082933 110.972451 0.000000 Months of Experience 68.649623 8.108117 8.466778 0.000000 Female (1 if female, o if male) 1020.760726 292.297351 3.492200 0.002791 Step 1 of 2: In this regression equation, what is the intercept value for men? Enter your answer in the space provided. Do not round your answer. Answer(How to Enter) 2 Points Keypad Keyboard Shortcuts Suppose the following table was generated from the sample data of 20 teachers relating annual salary to months of teaching experience and gender. Coefficients Standard Error t Stat P-Value Intercept 38849.561301 350.082933 110.972451 0.000000 Months of Experience 68.649623 8.108117 8.466778 0.000000 Female (1 if female, o if male) 1020.760726 292.297351 3.492200 0.002791 Step 2 of 2: In this regression equation, what is the intercept value for women? Enter your answer in the space provided. Do not round your answer. Answer(How to Enter) 2 Points Keypad Keyboard Shortcuts
Step by Step Solution
There are 3 Steps involved in it

Get step-by-step solutions from verified subject matter experts