

Question: Suppose the graph below represents the demand and supply for rice at various prices, answer the question below: allTelstra Wi-Fi Call - 5:19 PM Question
Suppose the graph below represents the demand and supply for rice at various prices, answer the question below:
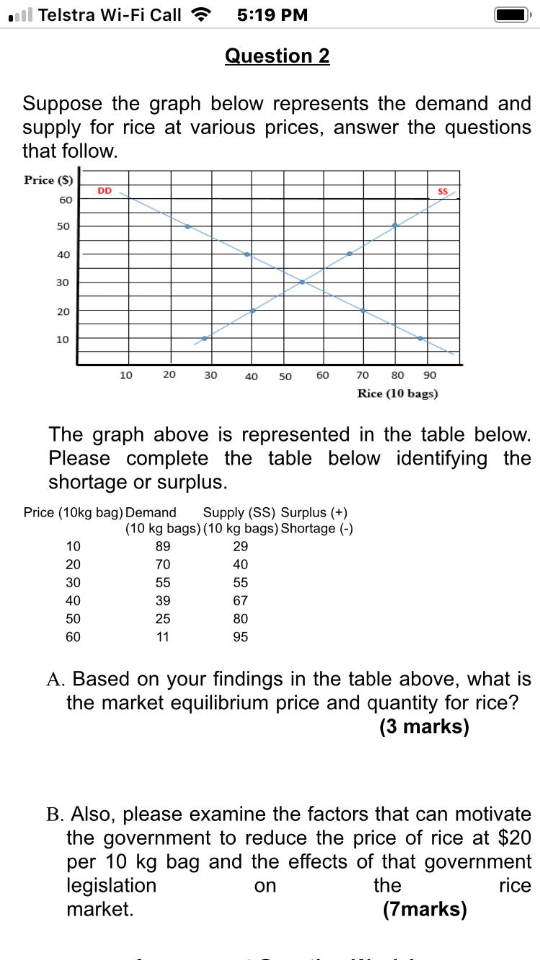
allTelstra Wi-Fi Call - 5:19 PM Question 2 Suppose the graph below represents the demand and supply for rice at various prices, answer the questions that follow. Price (S) DD 60 SS 50 40 30 20 10 10 20 30 40 50 60 70 80 90 Rice (10 bags) The graph above is represented in the table below. Please complete the table below identifying the shortage or surplus. Price (10kg bag) Demand Supply (SS) Surplus (+) (10 kg bags) (10 kg bags) Shortage (-) 10 89 29 20 70 40 30 55 55 40 39 67 50 25 80 60 11 95 A. Based on your findings in the table above, what is the market equilibrium price and quantity for rice? (3 marks) B. Also, please examine the factors that can motivate the government to reduce the price of rice at $20 legislation per 10 kg bag and the effects of that government on the rice market. (7marks)
Step by Step Solution
There are 3 Steps involved in it

Get step-by-step solutions from verified subject matter experts