

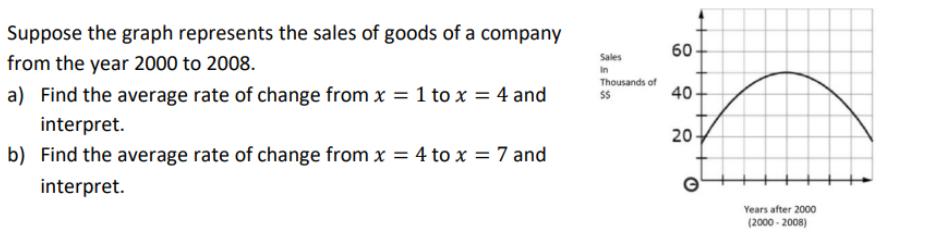
Suppose the graph represents the sales of goods of a company from the year 2000 to...
Fantastic news! We've Found the answer you've been seeking!
Question:
Expert Answer:

Related Book For 

Posted Date:
