

Question: Suppose the individual has collected information about a random subset of their journeys over the last one month. They are interested in learning about the
Suppose the individual has collected information about a random subset of their journeys over the last one month. They are interested in learning about the factors that affect the length of their journey, to help them plan their journeys in future. As well as the journey lengths, they have recorded information about a range of other variables that they believe may be of interest.
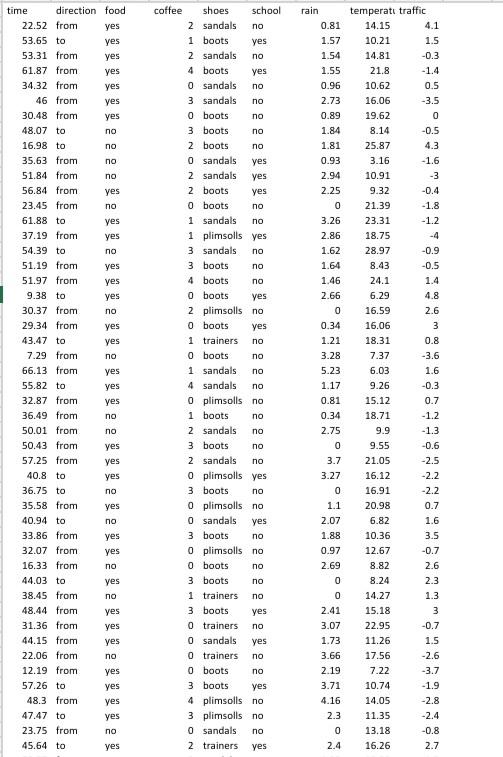
The variables in the dataset are as follows:
time: the time (in minutes) taken for the journey.
direction: either to or from, indicating whether the journey is to work or from work.
food: either yes or no, indicating whether the individual stopped to buy food on their journey.
coffee: sometimes the individual stops at a cafe to buy coffee for them and possibly some colleagues - this is the number of coffees purchased.
shoes: the type of shoes worn on the walk (either boots, plimsolls, sandals or trainers).
school: either yes or no, indicating whether the individual had to take their children to school or pick them up from school on the way to/from work.
rain: the amount of rain (in mm) that fell that day, measured at the individuals place of work.
temperature: the average temperature (in degrees Celsius) during the journey.
traffic: a numeric index for the amount of traffic on the roads during their journey, based on vehicle count. This is on a scale from -5 to 5, with smaller values representing light traffic and larger values representing heavy traffic. 1)Conduct an exploratory analysis of the data (remember, you shouldnt build a model here). You should bear in mind the research question of interest and make it accessible to a non-statistician.
In questions 2 to 4, well be considering linear regression models that use a single covariate from the dataset provided to model the variable time.
2)Taking time as the outcome and coffee as the predictor, fit the following two models, showing the R model summaries in your knitted document:
Model 1a: a linear regression model with coffee as a numeric covariate.
Model 1b: a linear regression model with coffee as a categorical covariate. Hint: use as.factor() to turn coffee into a categorical covariate.
Which of Model 1a and Model 1b do you prefer? Give a clear explanation of your reasoning and provide one or more plots to support your argument.
3)Taking time as the outcome and traffic as the predictor, fit another simple linear regression model, referred to as Model 2a. Show the R model summary in your knitted document.
Do you have any concerns about the linearity assumption for this model? Give a clear explanation of your reasoning and provide a plot to support your claim.
4)Attempt to transform the variable traffic using each of the following functions: traffic^2, log(traffic+5), sqrt(traffic+5).
Explain why I asked you to use +5 as part of the second and third transformations.
For each transformation, create a plot to assess the assumption of linearity between the response (time) and the transformed variable.
Which of these transformations do you prefer and why?
Fit another simple linear regression model, referred to as Model 2b, using your preferred transformation of traffic as the predictor. Show the R model summary in your knitted document.
Briefly comment on the main differences in the R output between Model 2a and Model 2b.
please answer in detailed and also work on Rstudio.
The file contains (simulated) data about the length of time it takes an individual to walk to/from their place of work. kindly tell me which type of detail you need?
Step by Step Solution
There are 3 Steps involved in it

Get step-by-step solutions from verified subject matter experts