

Question: Suppose we are interested in purchasing a multi-functioning inkjet printer. We want to see how the performance factors related to the price of the printer.
Suppose we are interested in purchasing a multi-functioning inkjet printer. We want to see how the performance factors related to the price of the printer. Collected data from 20 printers include below information.
PPM: Printing rate (pages per minutes) for a set of print jobs
Price: Typical retail price (in dollars) at the time of the review.
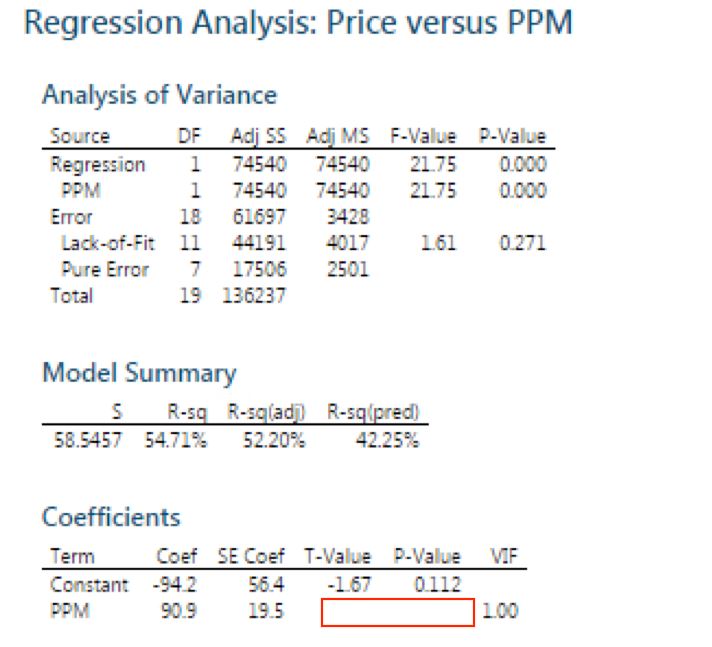
Data is not provided to you, but the default MINITAB output is provided to you. As you can see it is a partial output where you have to do some calculations using the provided information. Use the provided output to answer below questions.
- Write down the least squares regression line for predicting the price of a printer using printing rate.
- Interpret the slope parameter in the context of this problem?
- We want to test if printers with higher printing rate are more expensive. Write the appropriate null and alternative hypothesis you would formulate to test this, calculate the test statistic and the p value. Based on the p value you obtained, what can you say about the relationship?
- What is the correlation between PPM and the price?
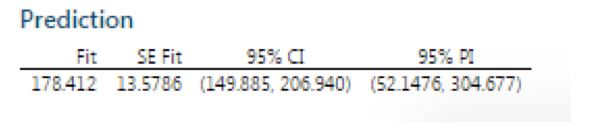
- Suppose we find an inkjet printer with a printing speed of 3 pages per minute for a sale price of $129. Is this a deal that should not be missed? Use the below provided 95% confidence and prediction intervals to answer this question. Explain the reason for your choice of interval to answer above question.
\f\f
Step by Step Solution
There are 3 Steps involved in it
Lets go through each part of the question 1 Least Squares Regression Line The least squares regression line has the equation textPrice b0 b1 times tex... View full answer

Get step-by-step solutions from verified subject matter experts