

Question: Suppose we divide the hypothetical population in Example 2.2 into clusters (we used this population to examine SRS and Stratified samples on the previous
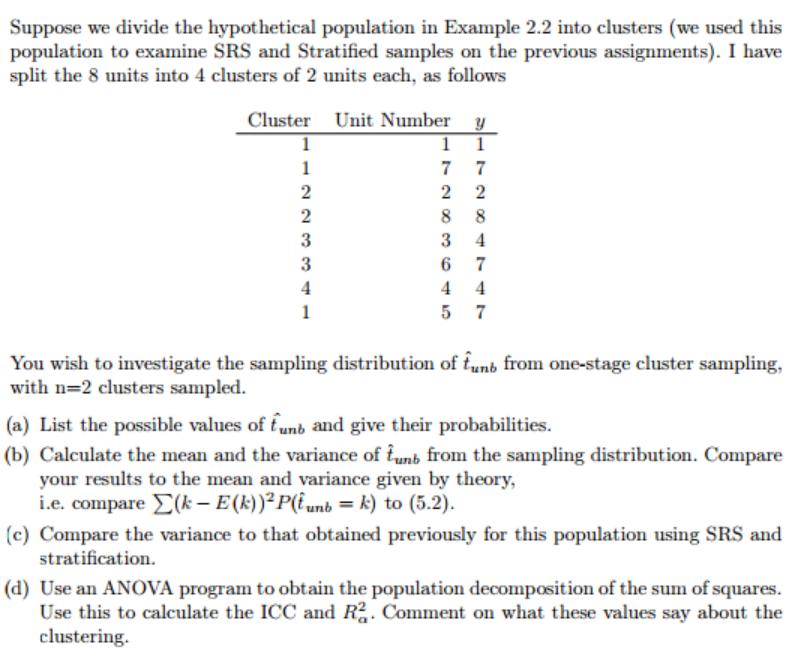
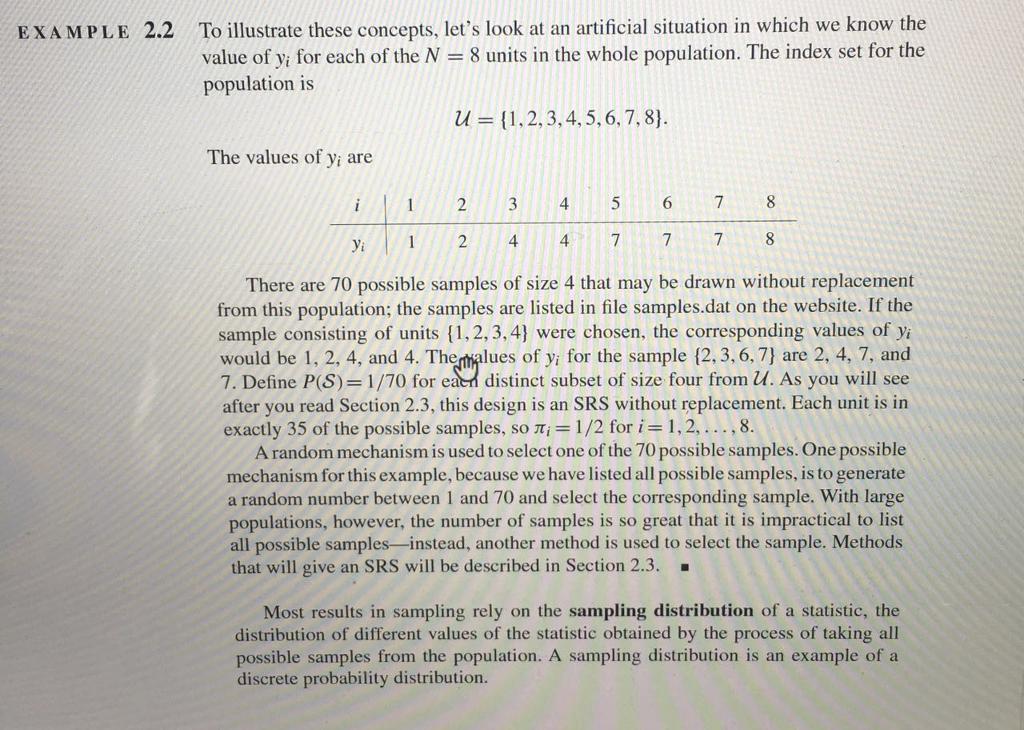
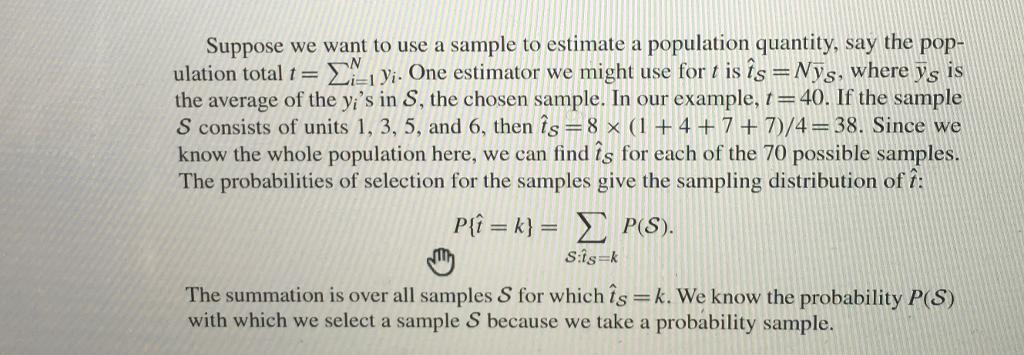
Suppose we divide the hypothetical population in Example 2.2 into clusters (we used this population to examine SRS and Stratified samples on the previous assignments). I have split the 8 units into 4 clusters of 2 units each, as follows Cluster Unit Number y 1 1 1 1 2 2 3 3 1 77 22 88 3 4 6 7 4 4 57 You wish to investigate the sampling distribution of funt from one-stage cluster sampling, with n=2 clusters sampled. (a) List the possible values of fun and give their probabilities. (b) Calculate the mean and the variance of funt from the sampling distribution. Compare your results to the mean and variance given by theory, i.e. compare (k-E(k))2 P(unb = k) to (5.2). (c) Compare the variance to that obtained previously for this population using SRS and stratification. (d) Use an ANOVA program to obtain the population decomposition of the sum of squares. Use this to calculate the ICC and R. Comment on what these values say about the clustering. EXAMPLE 2.2 To illustrate these concepts, let's look at an artificial situation in which we know the value of y; for each of the N = 8 units in the whole population. The index set for the population is The values of y; are i 1 Yi 1 U= {1, 2, 3, 4, 5, 6, 7, 8). 2 3 4 4 4 5 7 6 7 7 8 7 There are 70 possible samples of size 4 that may be drawn without replacement from this population; the samples are listed in file samples.dat on the website. If the sample consisting of units {1,2,3,4} were chosen, the corresponding values of yi would be 1, 2, 4, and 4. The malues of y; for the sample (2,3,6,7} are 2, 4, 7, and 7. Define P(S)=1/70 for each distinct subset of size four from U. As you will see after you read Section 2.3, this design is an SRS without replacement. Each unit is in exactly 35 of the possible samples, so = 1/2 for i=1,2,...,8. A random mechanism is used to select one of the 70 possible samples. One possible mechanism for this example, because we have listed all possible samples, is to generate a random number between 1 and 70 and select the corresponding sample. With large populations, however, the number of samples is so great that it is impractical to list all possible samples instead, another method is used to select the sample. Methods that will give an SRS will be described in Section 2.3. 8 Most results in sampling rely on the sampling distribution of a statistic, the distribution of different values of the statistic obtained by the process of taking all possible samples from the population. A sampling distribution is an example of a discrete probability distribution. Suppose we want to use a sample to estimate a population quantity, say the pop- ulation total t = y. One estimator we might use for t is s = Nys, where ys is the average of the y's in S, the chosen sample. In our example, t = 40. If the sample S consists of units 1, 3, 5, and 6, then s = 8 x (1 +4+7+7)/4= 38. Since we know the whole population here, we can find s for each of the 70 possible samples. The probabilities of selection for the samples give the sampling distribution of 1: P{=k} = P(s). S:1s=k The summation is over all samples S for which is =k. We know the probability P(S) with which we select a sample S because we take a probability sample.
Step by Step Solution
3.59 Rating (184 Votes )
There are 3 Steps involved in it
a 10 times H H H T H T T H H T The number of heads in the ... View full answer

Get step-by-step solutions from verified subject matter experts