

Question: Suppose we fit a multiple regression model. The following diagnostic plots were obtained: Residuals vs Fitted Normal Q-Q plot Question 2 Not answered Marked out
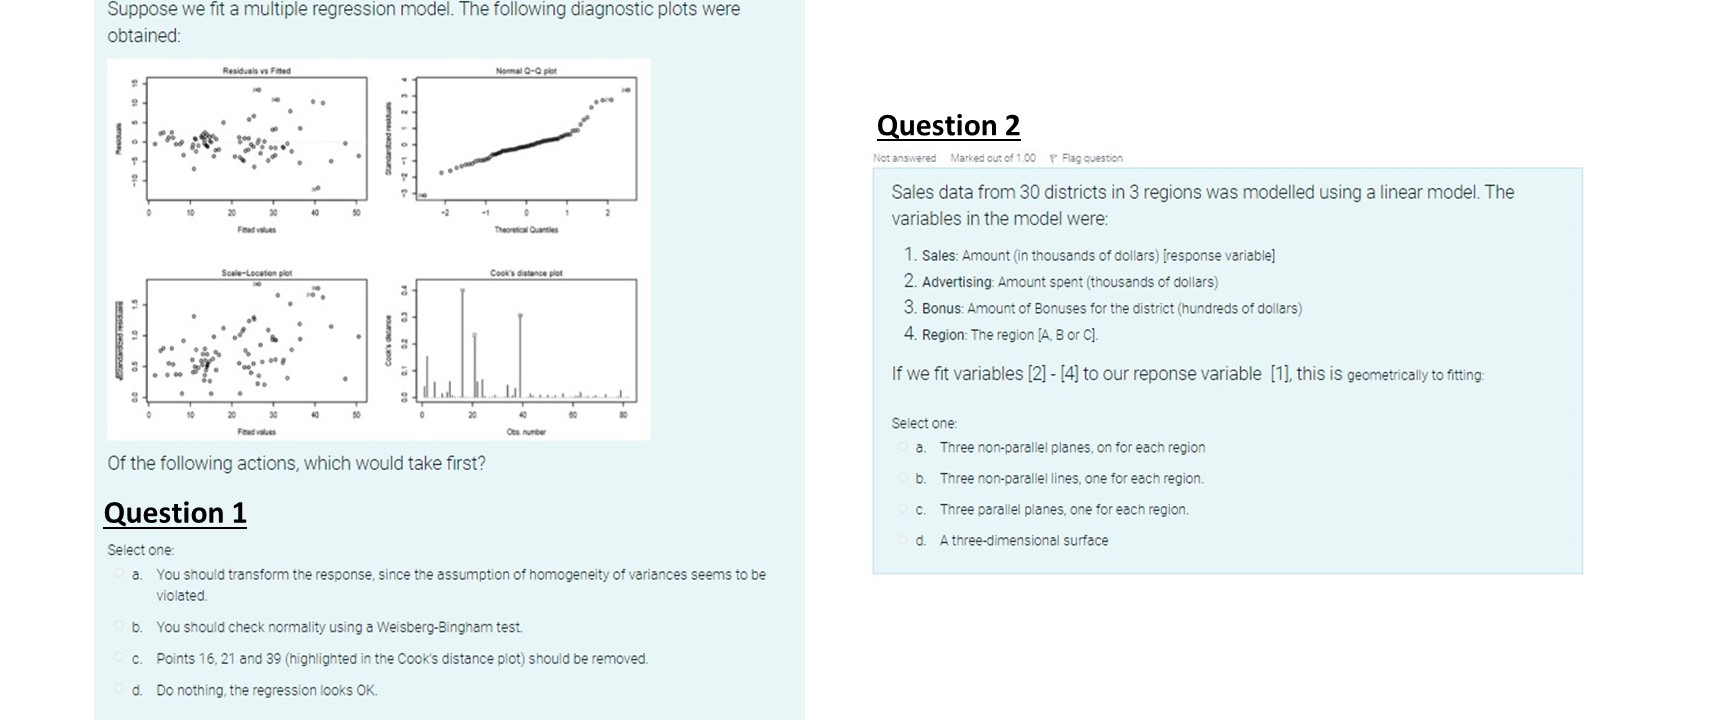
Suppose we fit a multiple regression model. The following diagnostic plots were obtained: Residuals vs Fitted Normal Q-Q plot Question 2 Not answered Marked out of 1.00 1 Flag question -10 Sales data from 30 districts in 3 regions was modelled using a linear model. The variables in the model were: Feed valves 1. Sales: Amount (in thousands of dollars) [response variable] Scale-Location plot Cook's distance plot 2. Advertising: Amount spent (thousands of dollars) 04 3. Bonus: Amount of Bonuses for the district (hundreds of dollars) 02 03 4. Region: The region [A, B or C]. Cook's If we fit variables [2] - [4] to our reponse variable [1], this is geometrically to fitting: Con number Select one: a. Three non-parallel planes, on for each region Of the following actions, which would take first? b. Three non-parallel lines, one for each region. Question 1 c. Three parallel planes, one for each region. d. A three-dimensional surface Select one: a. You should transform the response, since the assumption of homogeneity of variances seems to be violated. b. You should check normality using a Weisberg-Bingham test. C. Points 16, 21 and 39 (highlighted in the Cook's distance plot) should be removed. d. Do nothing, the regression looks OK
Step by Step Solution
There are 3 Steps involved in it

Get step-by-step solutions from verified subject matter experts