

Question: Suppose you are constructing either a mean chart with known variation or a p-chart to monitor some process. The process will only be stopped if
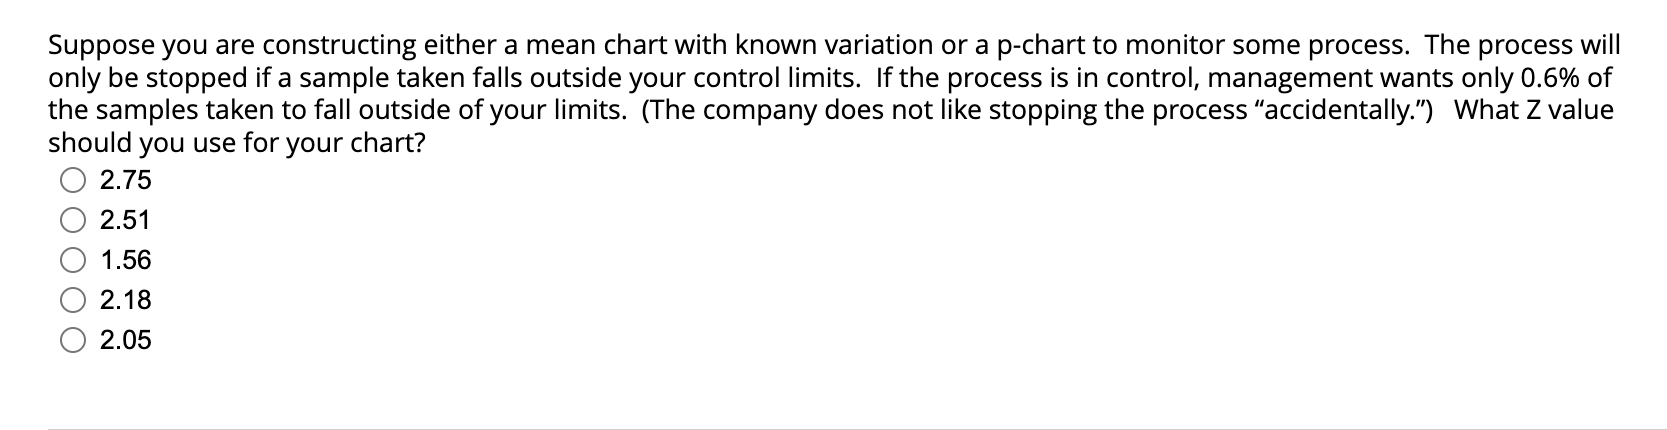
Suppose you are constructing either a mean chart with known variation or a p-chart to monitor some process. The process will only be stopped if a sample taken falls outside your control limits. If the process is in control, management wants only 0.6% of the samples taken to fall outside of your limits. (The company does not like stopping the process "accidentally.") What Z value should you use for your chart? 2.752.511.562.182.05
Step by Step Solution
There are 3 Steps involved in it
1 Expert Approved Answer
Step: 1 Unlock

Question Has Been Solved by an Expert!
Get step-by-step solutions from verified subject matter experts
Step: 2 Unlock
Step: 3 Unlock