

Question: Suppose you computed the following correlation coefficients. Using the table, determine whether ris significant and whether the line of best fit associated with each
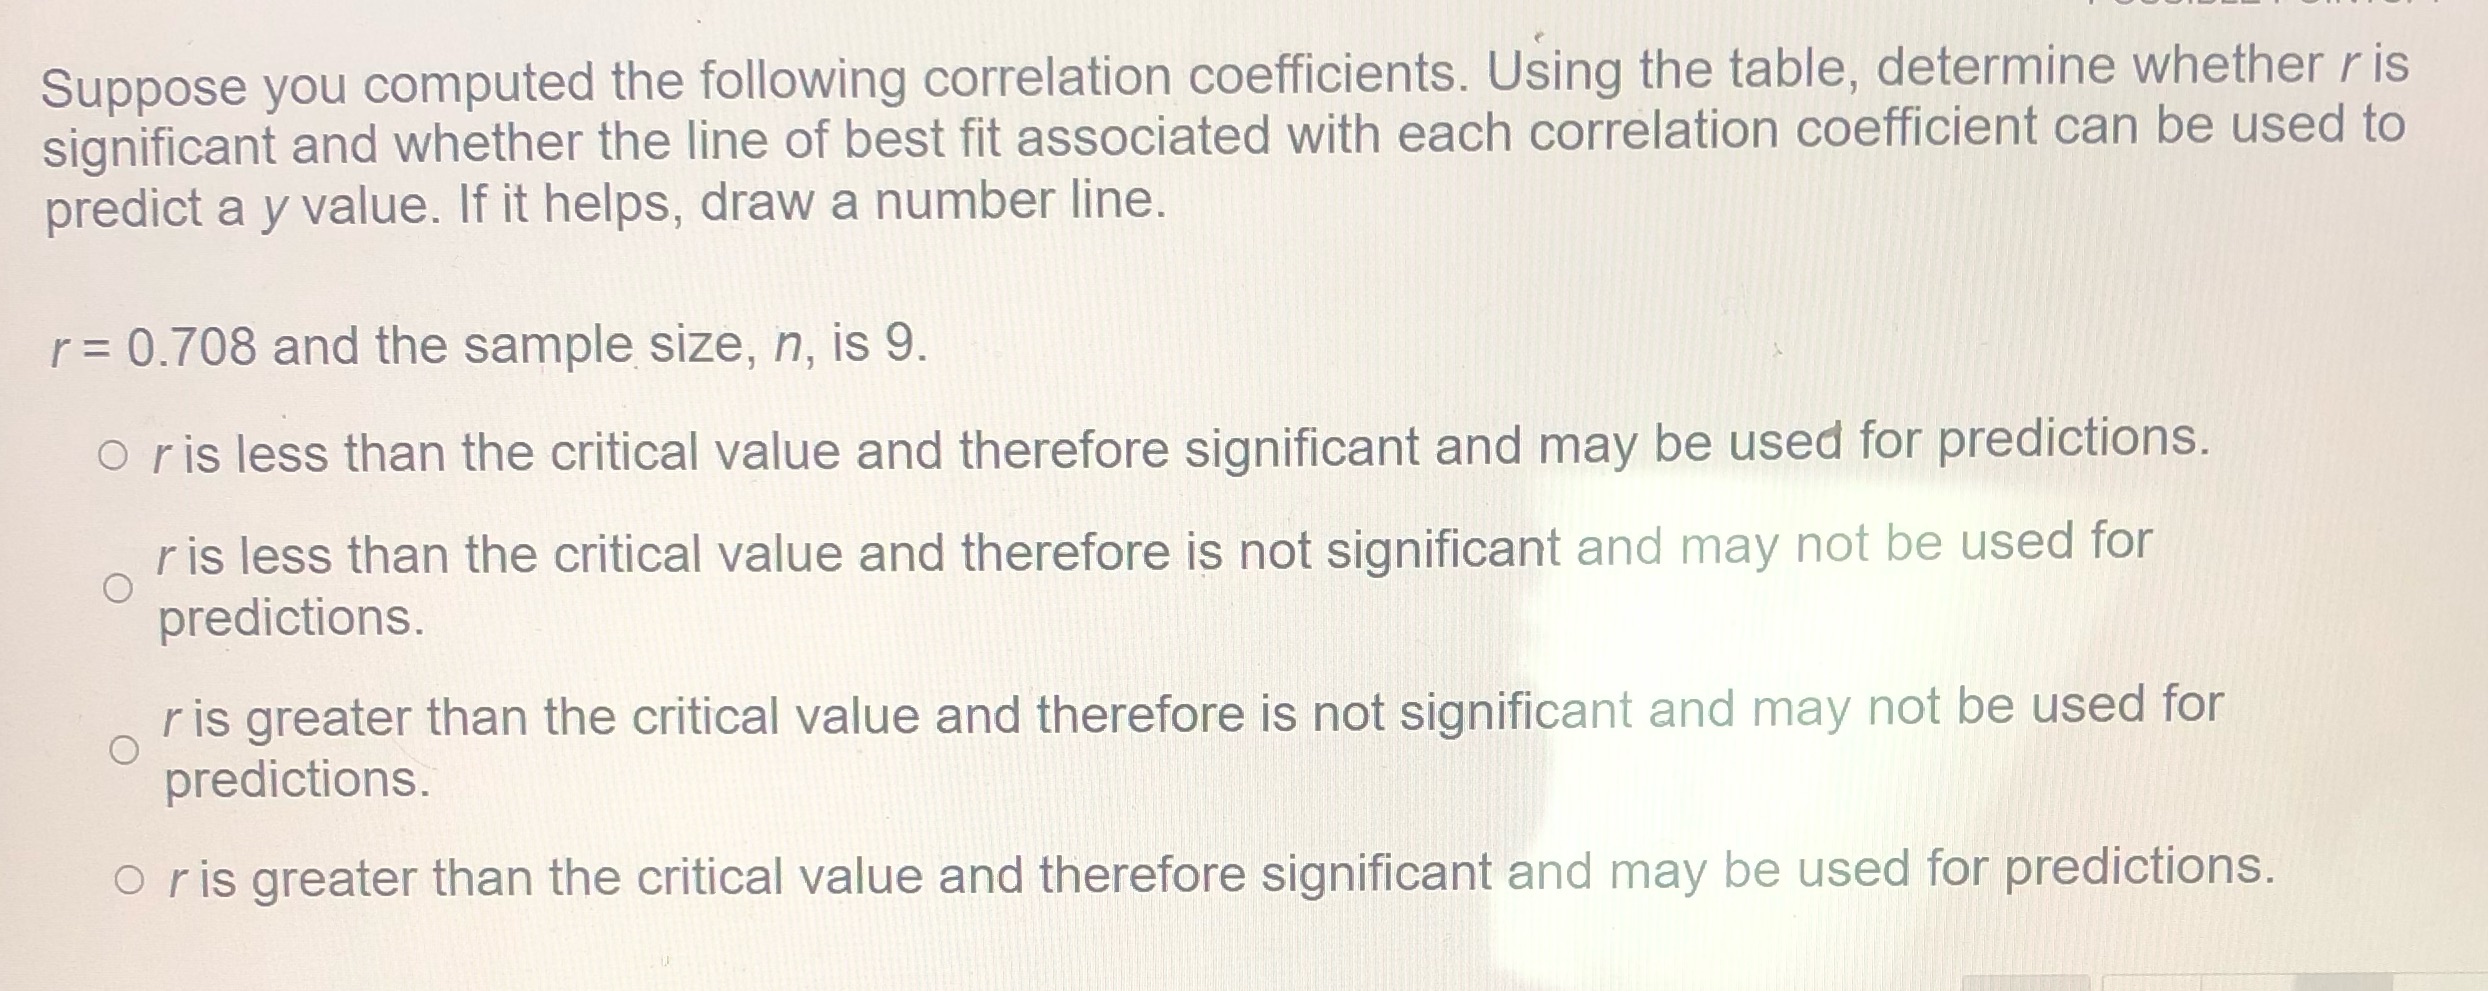
Suppose you computed the following correlation coefficients. Using the table, determine whether ris significant and whether the line of best fit associated with each correlation coefficient can be used to predict a y value. If it helps, draw a number line. r = 0.708 and the sample size, n, is 9. Oris less than the critical value and therefore significant and may be used for predictions. r is less than the critical value and therefore is not significant and may not be used for predictions. r is greater than the critical value and therefore is not significant and may not be used for predictions. or is greater than the critical value and therefore significant and may be used for predictions.
Step by Step Solution
There are 3 Steps involved in it

Get step-by-step solutions from verified subject matter experts