

Question: Suppose you estimate a simple linear regression model for pro fits from hot dog sales at football stadiums based on the total number of fans
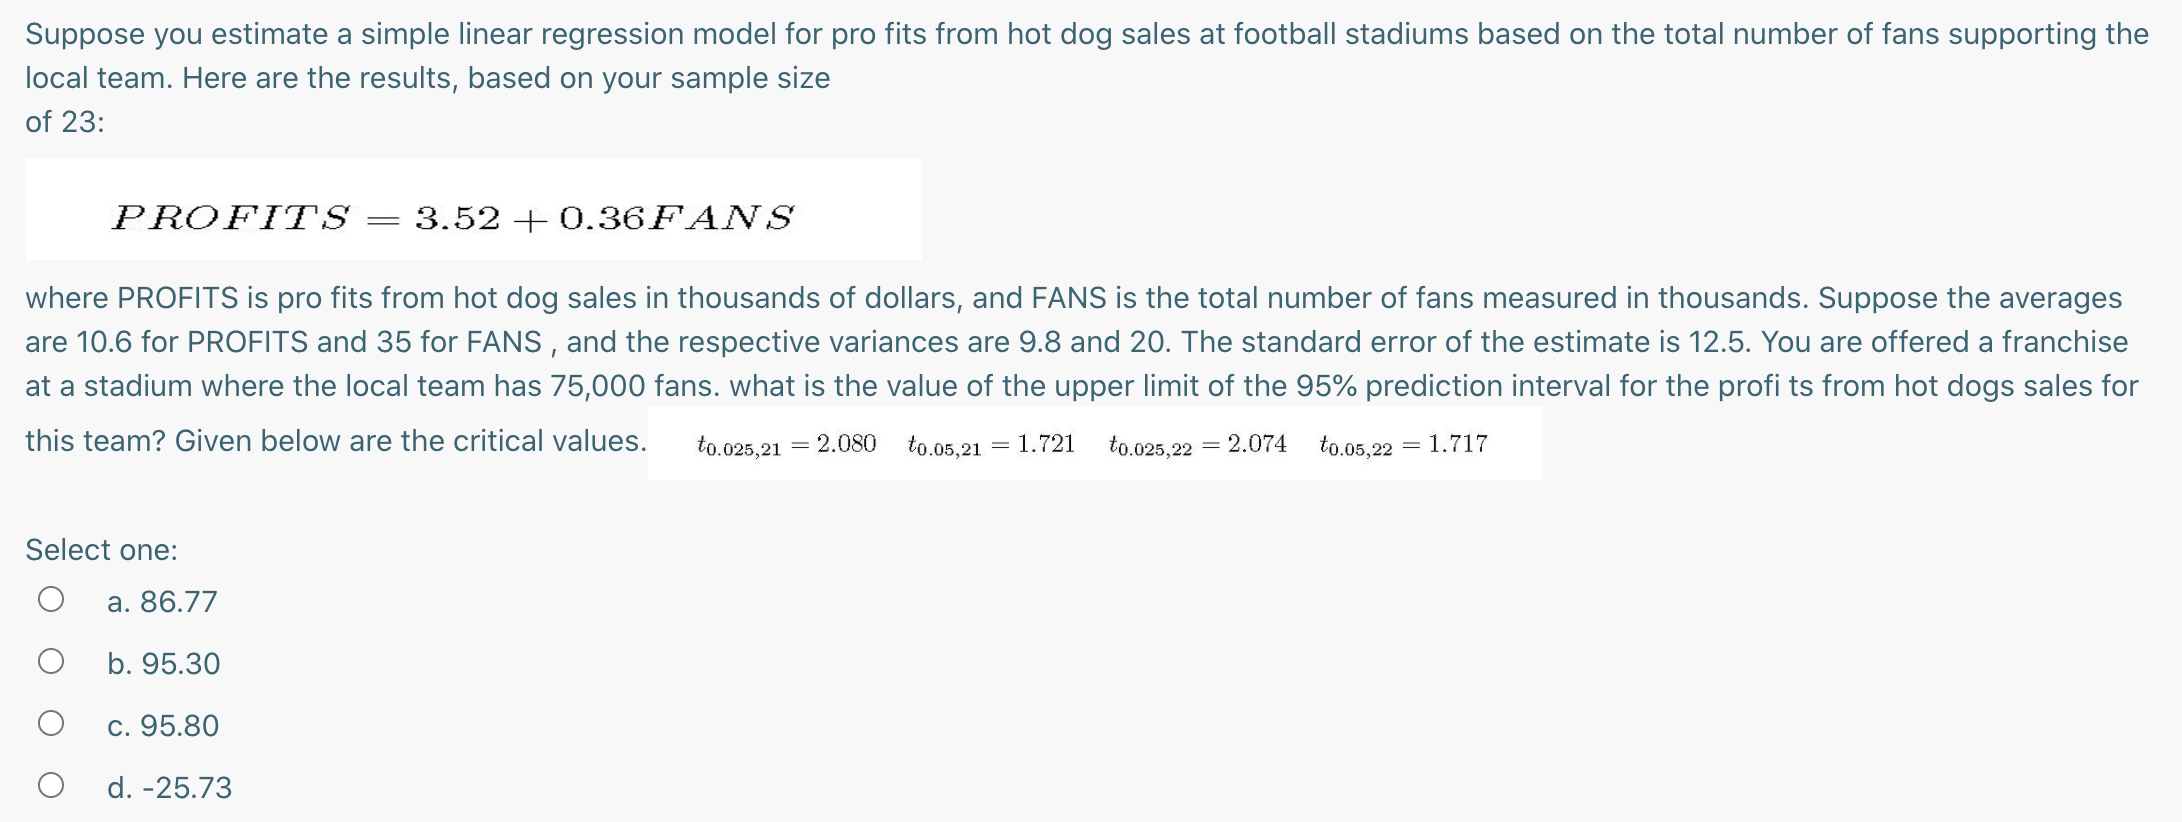
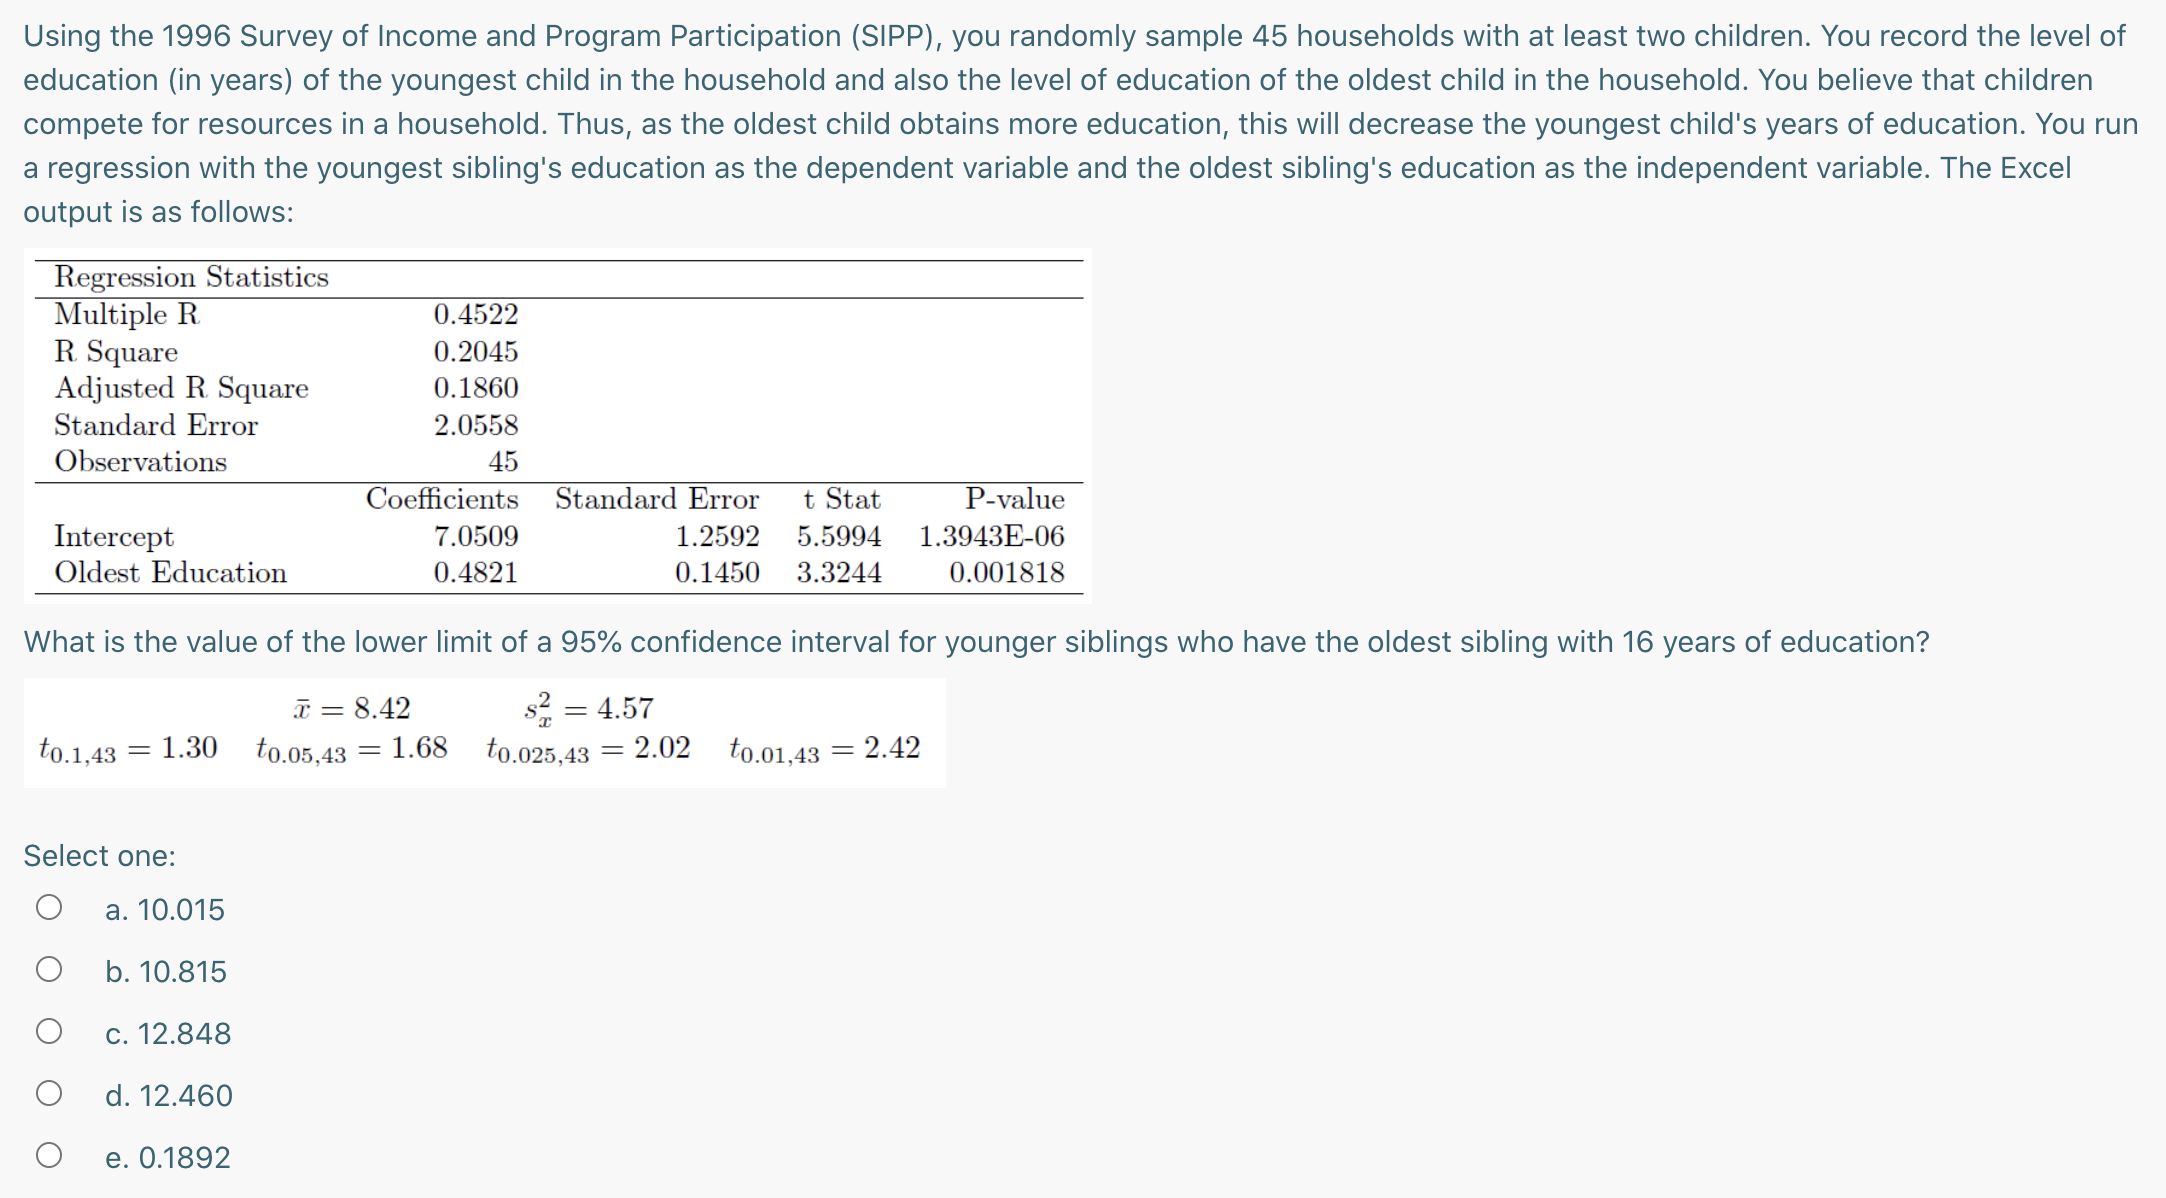
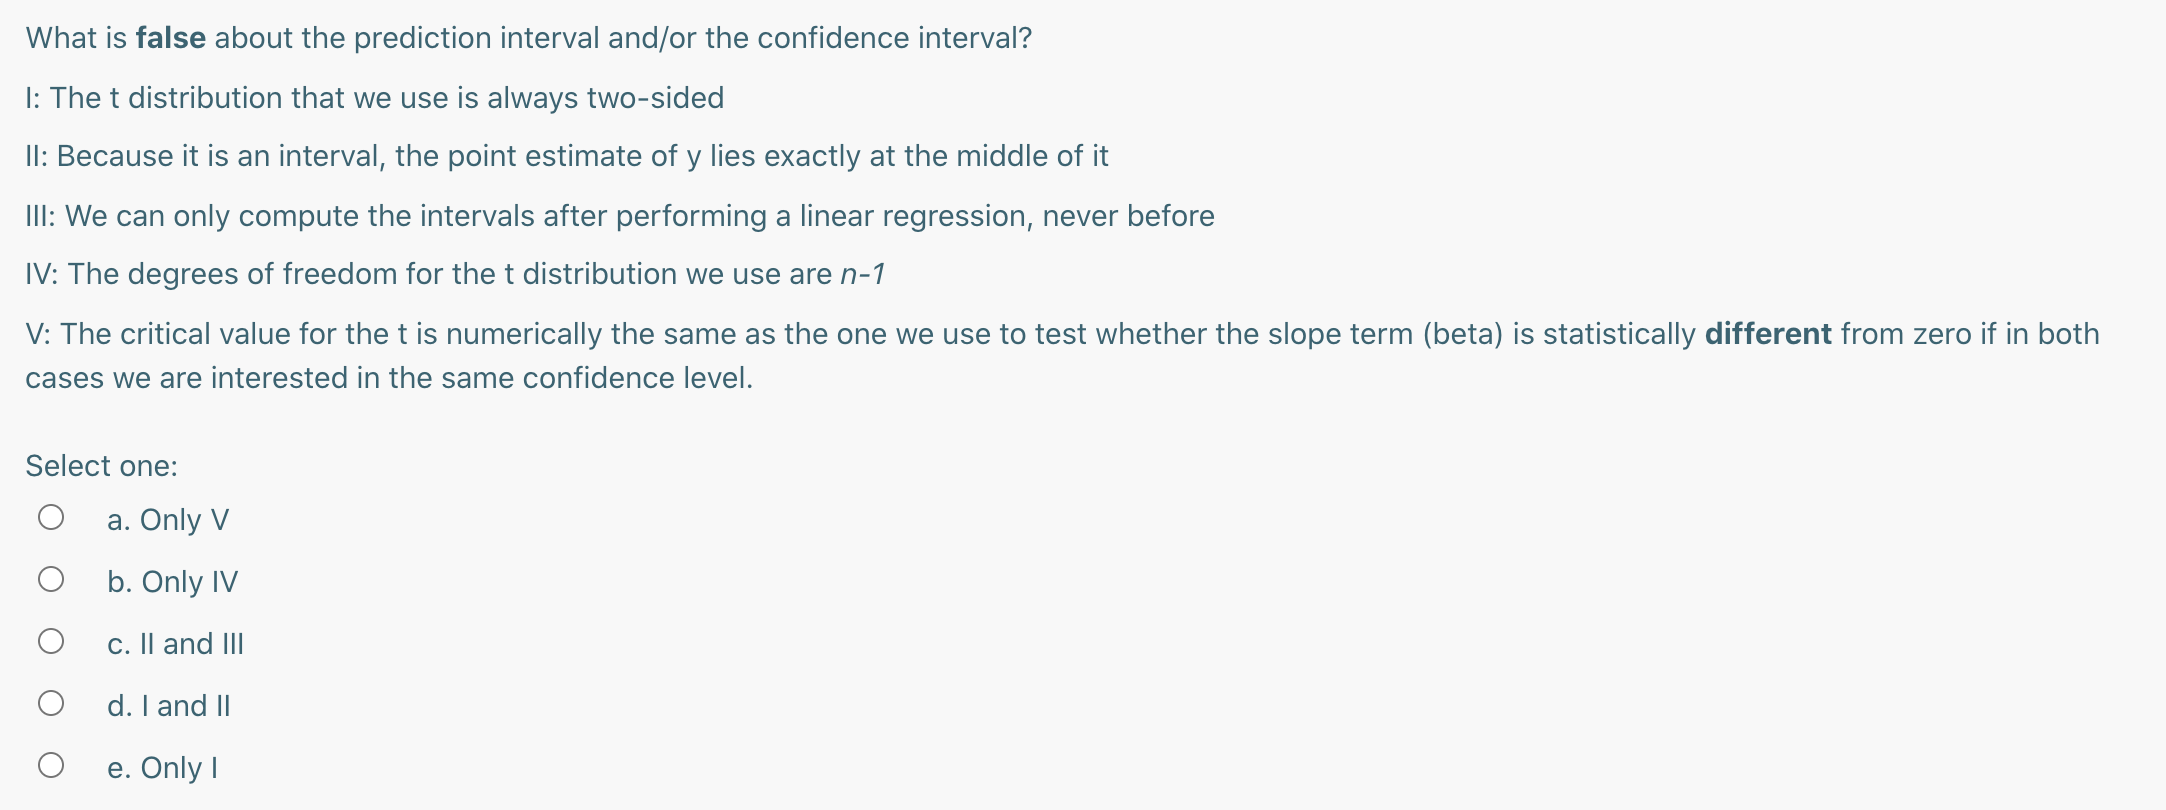
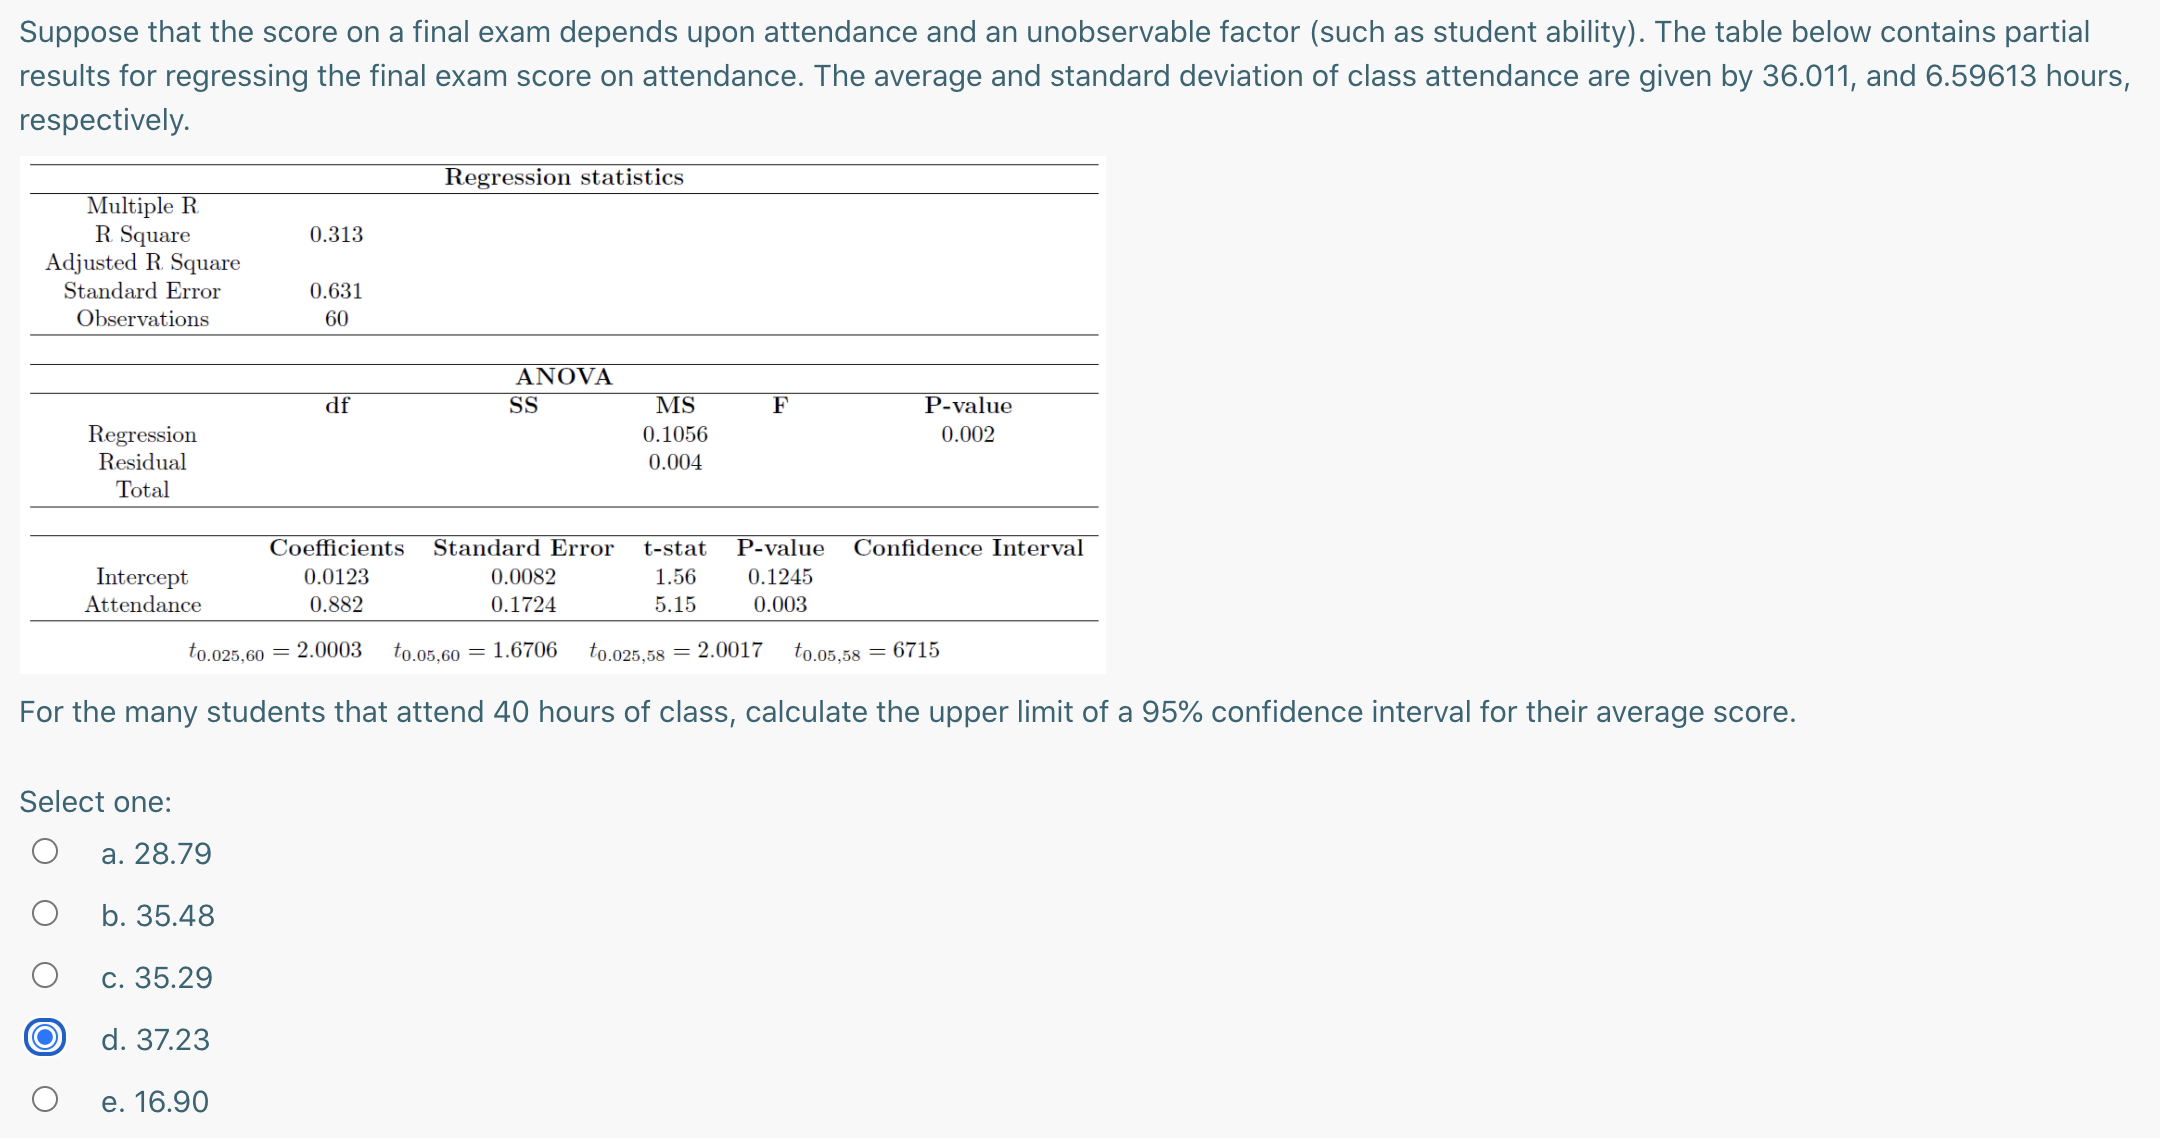
Suppose you estimate a simple linear regression model for pro fits from hot dog sales at football stadiums based on the total number of fans supporting the local team. Here are the results, based on your sample size of 23: PROFITS = 3.52 + 0.36FANS where PROFITS is pro fits from hot dog sales in thousands of dollars, and FANS is the total number of fans measured in thousands. Suppose the averages are 10.6 for PROFITS and 35 for FANS , and the respective variances are 9.8 and 20. The standard error of the estimate is 12.5. You are offered a franchise at a stadium where the local team has 75,000 fans. what is the value of the upper limit of the 95% prediction interval for the profi ts from hot dogs sales for this team? Given below are the critical values. tomw = 2.080 town = 1.721 toms}; = 2074 7311.05.22 = 1.717 Select one: Q a. 86.77 O b. 95.30 0 c. 95.80 0 d. -25.73 Using the 1996 Survey of Income and Program Participation (SIPP), you randomly sample 45 households with at least two children. You record the level of education (in years) of the youngest child in the household and also the level of education of the oldest child in the household. You believe that children compete for resources in a household Thus, as the oldest child obtains more education, this will decrease the youngest child's years of education. You run a regression with the youngest sibling's education as the dependent variable and the oldest sibling's education as the independent variable. The Excel output is as follows: Regression Statistics Multiple R 0.4522 R Square 0.2045 Adjusted R. Square 0.1860 Standard Error 2.0558 Observations 45 Coefficients Standard Error t Stat P-value Intercept 7.0509 1.2592 5.5994 1.3943E06 Oldest Education 04821 0.1450 3.3244 0.001818 What is the value of the lower limit of a 95% confidence interval for younger siblings who have the oldest sibling with 16 years of education? i = 8.42 s: = 4.57 to.1,43 = 1-30 1E0.05.43 = \"38 t0325,43 = 2-02 t001,43 = 2-42 Select one: Q a. 10.015 0 b. 10.815 0 c. 12.848 0 d. 12.460 0 e. 0.1892 What is false about the prediction interval and/or the confidence interval? I: The t distribution that we use is always two-sided II: Because it is an interval, the point estimate of y lies exactly at the middle of it III: We can only compute the intervals after performing a linear regression, never before IV: The degrees of freedom for the t distribution we use are n-1 V: The critical value for the t is numerically the same as the one we use to test whether the slope term (beta) is statistically different from zero if in both cases we are interested in the same confidence level. Select one: 0 a. Only V O b. Only IV 0 C. II and III 0 d. | and H 0 e. Only | Suppose that the score on a final exam depends upon attendance and an unobservable factor (such as student ability). The table below contains partial results for regressing the final exam score on attendance. The average and standard deviation of class attendance are given by 36.011, and 6.59613 hours, respectively. Regression statistics Multiple R R Square 0.313 Adjusted R. Square Standard Error 0.631 Observations 60 ANOVA df SS MS F P-value Regression 0.1056 0.002 Residual 0.004 Total Coefficients Standard Error t-stat P-value Confidence Interval Intercept 0.0123 0.0082 1.56 0.1245 Attendance 0.882 0.1724 5.15 0.003 to.025,60 = 2.0003 to.05,60 = 1.6706 to.025,58 = 2.0017 to.05,58 = 6715 For the many students that attend 40 hours of class, calculate the upper limit of a 95% confidence interval for their average score. Select one: O a. 28.79 O b. 35.48 O c. 35.29 O d. 37.23 O e. 16.90
Step by Step Solution
There are 3 Steps involved in it

Get step-by-step solutions from verified subject matter experts