

Question: sure to include your name, page number, etc. Keep it concise yet descriptive. Report should be typed and excel file should be sent with your
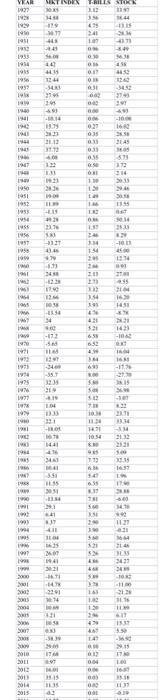
sure to include your name, page number, etc. Keep it concise yet descriptive. Report should be typed and excel file should be sent with your report. Before starting your assignment, please read and follow the "case grading rubrie" (Appendix II) and make sure you have all the criteria in your report. ANALYSIS OF HISTORICAL DATA You will find historical data (rates of return) for major assets classes from 1927-2016. (Stock, Market Index, and T-bills) in the Excel Spreadsheet that provided to you. You need to analysis the following steps: Part A: Calculate the followings statistics for stock return, market index return, and T-bills return during period 1927- 2016 by using the Excel functions. 1. Average return 2. Variance 3. Standard deviation Part B: Calculate the following statistics for stock and market returns each subperiod (1 to 4) and T-bills average return for each period by using the Excel functions. 1. For 1927-2016 period, average return, standard deviation 2. For 1927-1956 period, average return, standard deviation 3. For 1957-1987 period, average return, standard deviation 4. For 1988-2016 period, average return, standard deviation 5. Calculate the T-bills average returns for each period Part C: Calculate the correlation between stock returns and market returns and then calculate the Beta for each period. 1. For 1927-2016 period, correlation, and Beta 2. For 1927-1956 period, correlation, and Beta 3. For 1957-1987 period, correlation, and Beta 4. For 1988-2016 period, correlation, and Beta Part D: Calculate the expected rate of return from CAPM for each period by using the followings 1. Market average return for each period that you calculated in Part B 2. T-bills average return for each period (proxy for the risk free rate) that you calculated in Part B 3. Beta that you calculated for each period in Part C. Part E: Based on your calculation in Part A, B, and C, answer the following questions. 1. How stable Beta for each subperiod? Explain? 2. If it does, why expected rates of return from CAPM changes significantly from period to period? Why? Part F: Summary Summarize what you learned from the history based on your analysis? VAR 1997 MTIDEN TRILIS STORE SI 1961 145 35 11 SE LERE 151 541 19 1 14 OH 1991 12 3145 10 TI -100 1 13 1941 LO SCO LE CHE 2145 113 40 SO 313 190 11 21 301 11 15 10 19 1950 1951 1952 1953 1954 119 1 * 11 1956 1997 LO 11 24 13 154 20 - WO - IN 19 MAN 34 13 144 16 HE 41 16 14 - - 698 19 1972 IW CA -11 1913 IN 1975 -35 235 SEN NAI 16 SIE sor SE 1999 WA IN 10 0233 10 1134 1 1054 16 2013 1441 19 S. 41 SEDE 16.11 19 TEX 166 LE 695 19 11 ON LE 661 81 411 1121 1994 Sol TE SW he 1901 15 36 1941 3221 CER WY 2000 10 14 101 TE WC F -30 2010 SOLI WA IT 100 2.91 M CIOC 2014 2013 SER SET CP WO 100 ere sure to include your name, page number, etc. Keep it concise yet descriptive. Report should be typed and excel file should be sent with your report. Before starting your assignment, please read and follow the "case grading rubrie" (Appendix II) and make sure you have all the criteria in your report. ANALYSIS OF HISTORICAL DATA You will find historical data (rates of return) for major assets classes from 1927-2016. (Stock, Market Index, and T-bills) in the Excel Spreadsheet that provided to you. You need to analysis the following steps: Part A: Calculate the followings statistics for stock return, market index return, and T-bills return during period 1927- 2016 by using the Excel functions. 1. Average return 2. Variance 3. Standard deviation Part B: Calculate the following statistics for stock and market returns each subperiod (1 to 4) and T-bills average return for each period by using the Excel functions. 1. For 1927-2016 period, average return, standard deviation 2. For 1927-1956 period, average return, standard deviation 3. For 1957-1987 period, average return, standard deviation 4. For 1988-2016 period, average return, standard deviation 5. Calculate the T-bills average returns for each period Part C: Calculate the correlation between stock returns and market returns and then calculate the Beta for each period. 1. For 1927-2016 period, correlation, and Beta 2. For 1927-1956 period, correlation, and Beta 3. For 1957-1987 period, correlation, and Beta 4. For 1988-2016 period, correlation, and Beta Part D: Calculate the expected rate of return from CAPM for each period by using the followings 1. Market average return for each period that you calculated in Part B 2. T-bills average return for each period (proxy for the risk free rate) that you calculated in Part B 3. Beta that you calculated for each period in Part C. Part E: Based on your calculation in Part A, B, and C, answer the following questions. 1. How stable Beta for each subperiod? Explain? 2. If it does, why expected rates of return from CAPM changes significantly from period to period? Why? Part F: Summary Summarize what you learned from the history based on your analysis? VAR 1997 MTIDEN TRILIS STORE SI 1961 145 35 11 SE LERE 151 541 19 1 14 OH 1991 12 3145 10 TI -100 1 13 1941 LO SCO LE CHE 2145 113 40 SO 313 190 11 21 301 11 15 10 19 1950 1951 1952 1953 1954 119 1 * 11 1956 1997 LO 11 24 13 154 20 - WO - IN 19 MAN 34 13 144 16 HE 41 16 14 - - 698 19 1972 IW CA -11 1913 IN 1975 -35 235 SEN NAI 16 SIE sor SE 1999 WA IN 10 0233 10 1134 1 1054 16 2013 1441 19 S. 41 SEDE 16.11 19 TEX 166 LE 695 19 11 ON LE 661 81 411 1121 1994 Sol TE SW he 1901 15 36 1941 3221 CER WY 2000 10 14 101 TE WC F -30 2010 SOLI WA IT 100 2.91 M CIOC 2014 2013 SER SET CP WO 100 ere
Step by Step Solution
There are 3 Steps involved in it

Get step-by-step solutions from verified subject matter experts