

Question: Survey Data Now that you know how to interpret the data, review the data below. As you review the data, identify the data sets you
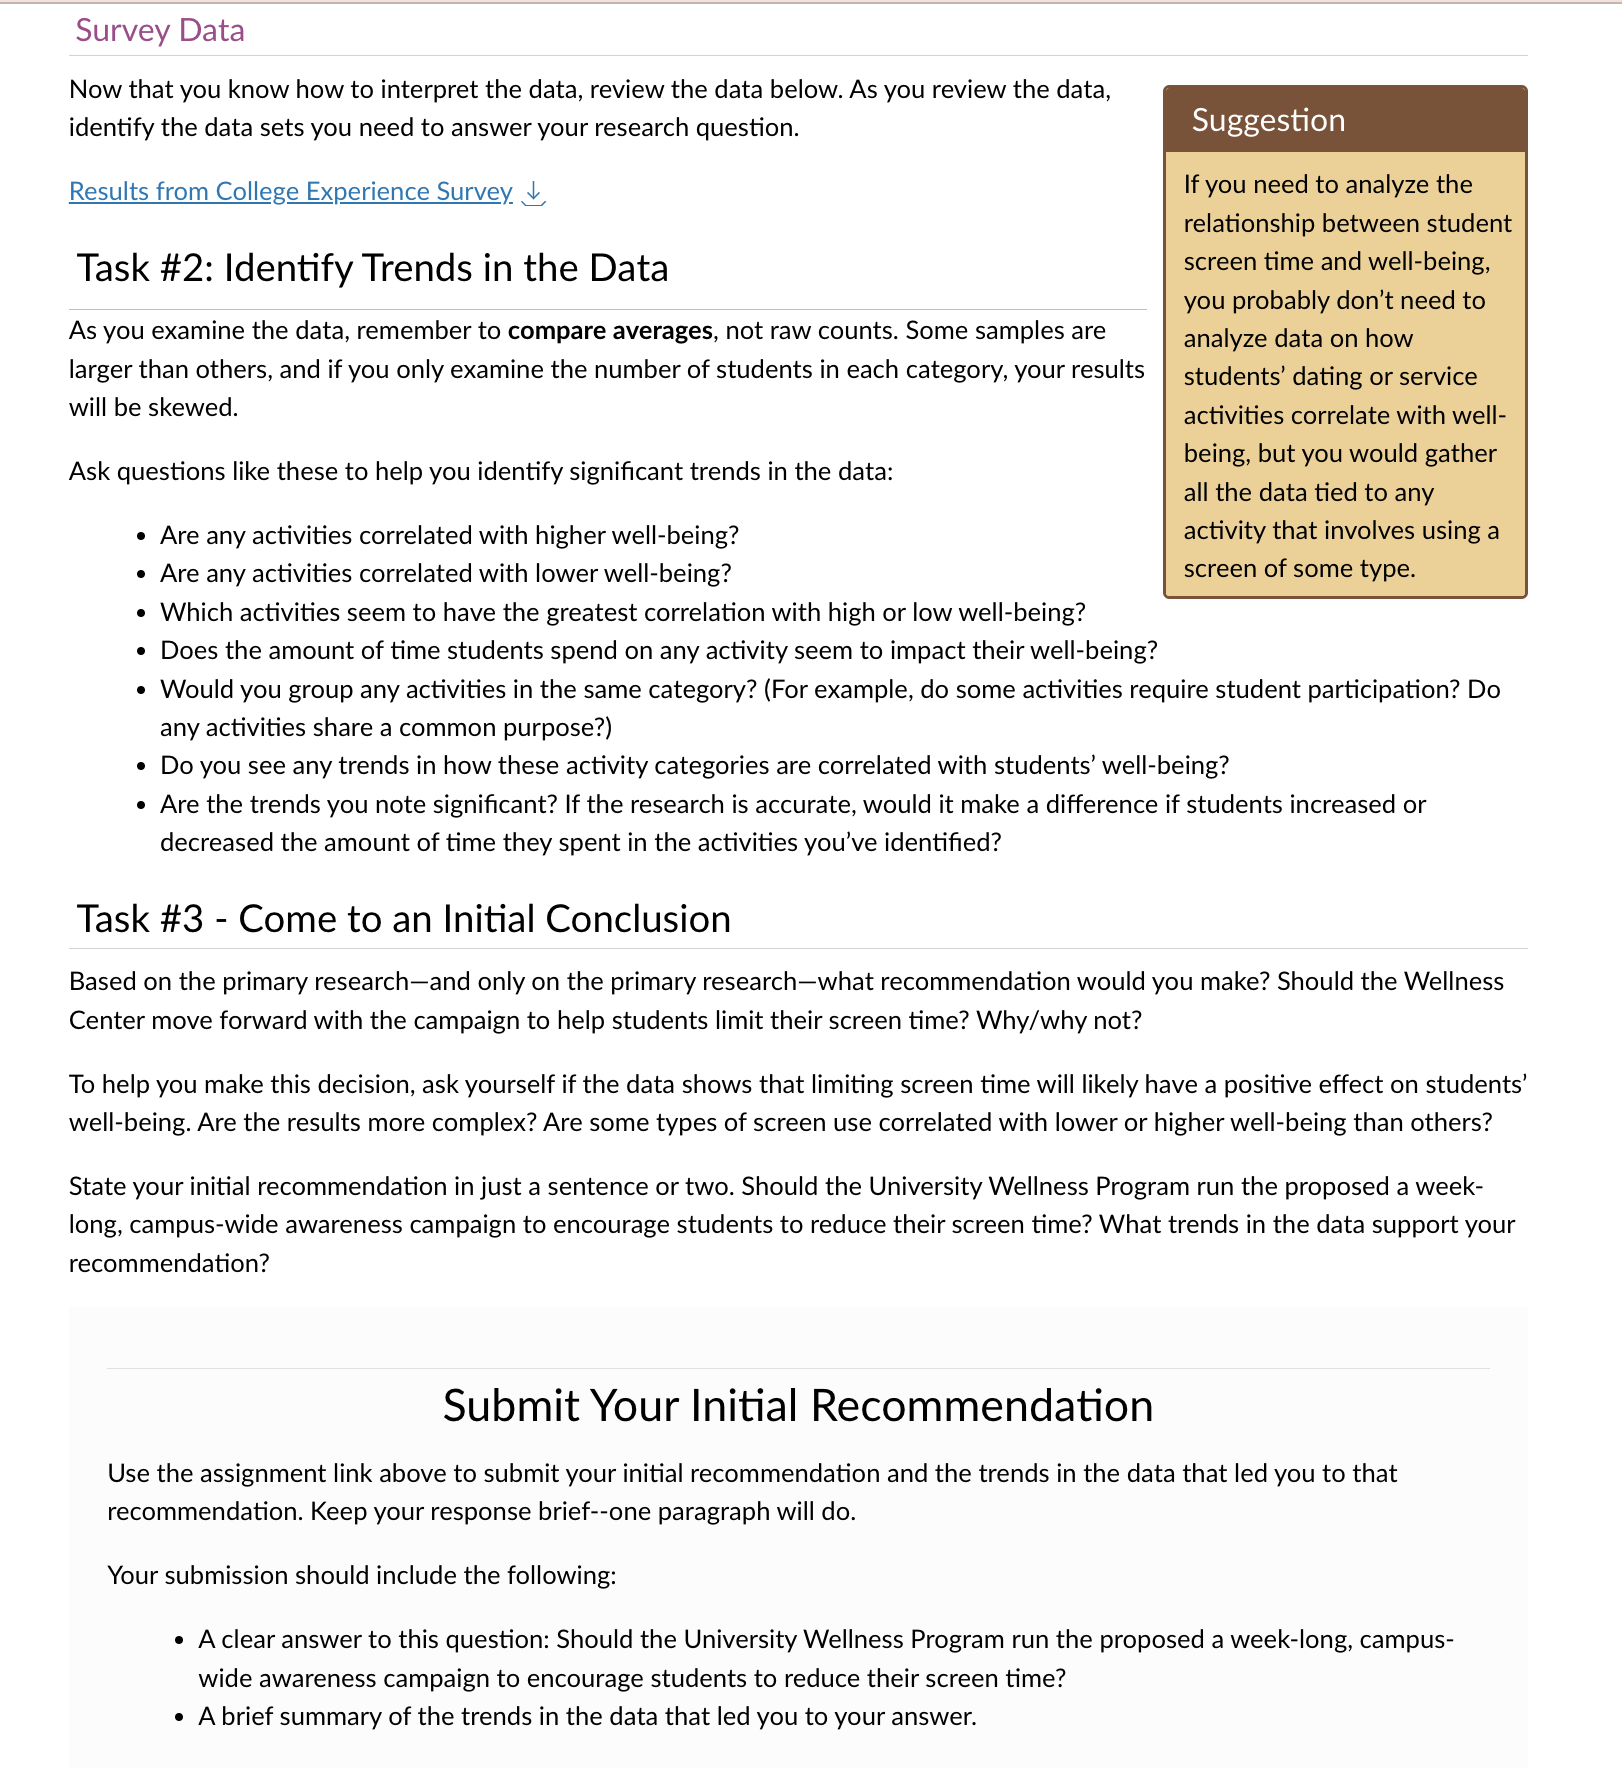
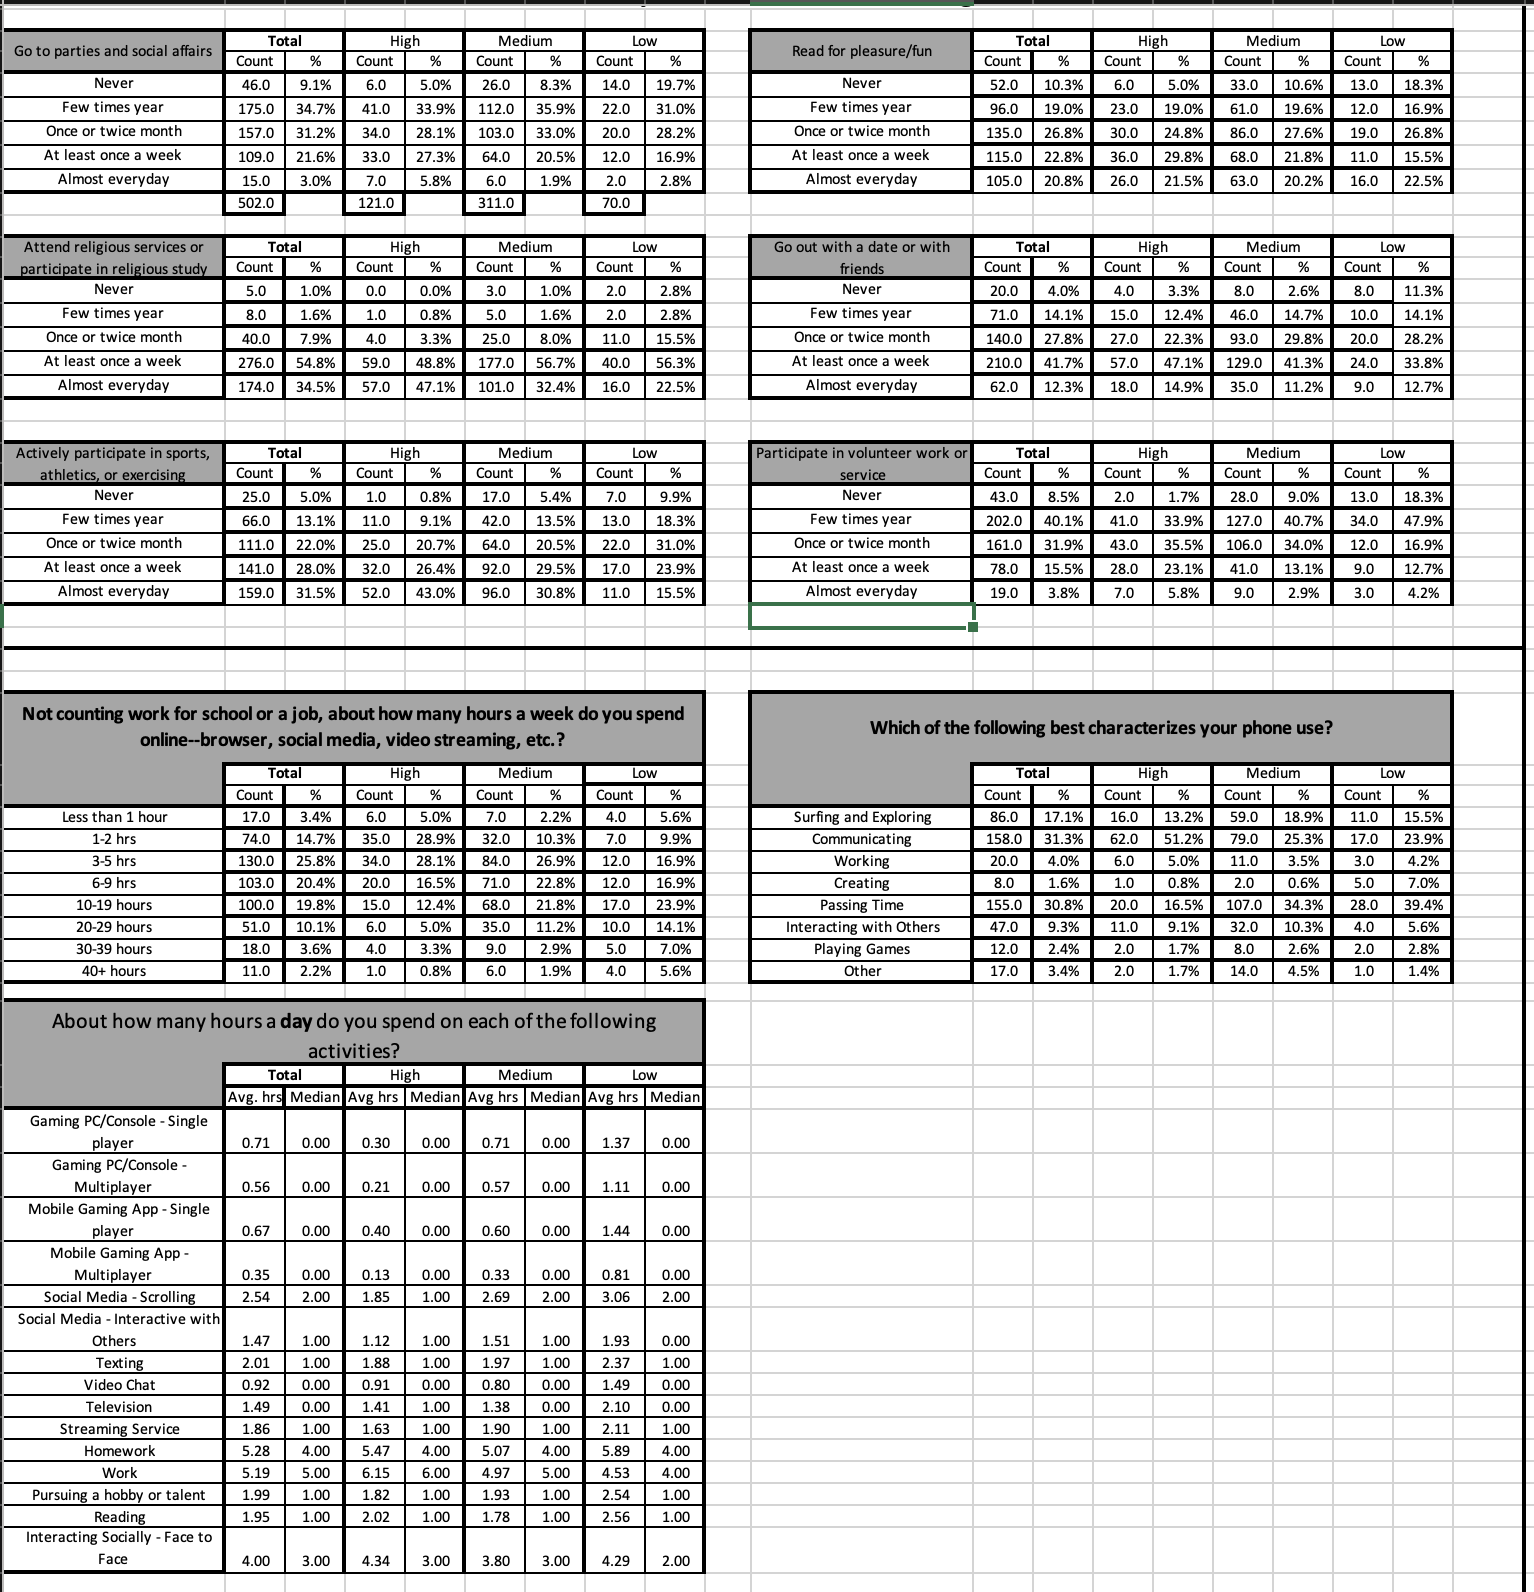
Survey Data Now that you know how to interpret the data, review the data below. As you review the data, identify the data sets you need to answer your research question. Suggestion Results from College Experience Survey If you need to analyze the relationship between student Task #2: Identify Trends in the Data screen time and well-being, you probably don't need to As you examine the data, remember to compare averages, not raw counts. Some samples are analyze data on how larger than others, and if you only examine the number of students in each category, your results | stydents' dating or service will be skewed. activities correlate with well- being, but you would gather all the data tied to any Are any activities correlated with higher well-being? activity that involves using a * Are any activities correlated with lower well-being? screen of some type. * Which activities seem to have the greatest correlation with high or low well-being? Ask questions like these to help you identify significant trends in the data: * Does the amount of time students spend on any activity seem to impact their well-being? * Would you group any activities in the same category? (For example, do some activities require student participation? Do any activities share a common purpose?) * Do you see any trends in how these activity categories are correlated with students' well-being? * Are the trends you note significant? If the research is accurate, would it make a difference if students increased or decreased the amount of time they spent in the activities you've identified? Task #3 - Come to an Initial Conclusion Based on the primary researchand only on the primary researchwhat recommendation would you make? Should the Wellness Center move forward with the campaign to help students limit their screen time? Why/why not? To help you make this decision, ask yourself if the data shows that limiting screen time will likely have a positive effect on students well-being. Are the results more complex? Are some types of screen use correlated with lower or higher well-being than others? State your initial recommendation in just a sentence or two. Should the University Wellness Program run the proposed a week- long, campus-wide awareness campaign to encourage students to reduce their screen time? What trends in the data support your recommendation? Submit Your Initial Recommendation Use the assignment link above to submit your initial recommendation and the trends in the data that led you to that recommendation. Keep your response brief--one paragraph will do. Your submission should include the following: A clear answer to this question: Should the University Wellness Program run the proposed a week-long, campus- wide awareness campaign to encourage students to reduce their screen time? A brief summary of the trends in the data that led you to your answer. Go to parties and social affairs Total High Medium Low High Medium Low Count % Count 9 Count 9 Count Read for pleasure/fun Total Count % Count % Count % Count % Never 46.0 9.1% 6.0 5.0% 26.0 8.3% 1 14.0 19.7% Never 52.0 10.3% 6.0 5.0% 33.0 10.6% 13.0 18.3% Few times year 175.0 34.7% 41.0 33.9% 112.0 35.9% 22.0 31.0% Few times year 96.0 19.0% 23.0 19.0% 61.0 19.6% 12.0 16.9% Once or twice month 157.0 31.2% 34.0 28.1% 103.0 33.0% 20.0 28.2% Once or twice month 135.0 26.8% 30.0 24.8% 86.0 27.6% 19.0 26.8% At least once a week 109.0 21.6% 0 27.3% 64.0 20.5% 12.0 16.9% At least once a wee 115.0 22.8% 36.0 29.8% 68.0 21.8% 11.0 15.5% Almost everyday 15.0 3.0% 7.0 5.8% 6.0 1.9% 2.0 2 Almost everyday 105.0 20.8% 26.0 21.5% 63.0 20.2% 16.0 22.5% 502.0 121.0 311.0 70.0 Attend religious services or Total Medium Low Go out with a date or with Total High Medium Low participate in religious study Count Count Count Count friends Count Count Count % Count Never 5.0 1.0% 0.0 0.0% .0 1.0% 2.0 2.8% Never 20.0 4.0% 4.0 3.3% 8.0 2.6% 8.0 11.3% Few times year 8.0 1.6% 0 0.8% 1.6% Few times year 71.0 14.1% 15.0 12.4% 46.0 14.7% 10.0 14.1% Once or twice month 40.0 7.9% 3.3% 25.0 8. 11.0 15.5% Once or twice month 140.0 27.8% 27.0 22.3% 93.0 29.8% 20.0 28.2% At least once a week 276.0 54.8% 59.0 48.8% 177.0 56.7% 40.0 56.3% At least once a week 210.0 41.7% 57.0 47.1% 129.0 41.3% 24.0 33.8% Almost everyday 174.0 34.5% 57.0 47.1% 101.0 32.4% 16.0 22.5% Almost everyday 62.0 12.3% 18.0 14.9% 35.0 11.2% 9.0 12.7% Actively participate in sports, Total High Medium Low Participate in volunteer work or Total High Medium Low athletics, or exercising Count % Count % Count % Count % service Count % Count % Count % Count % Never 25.0 5.0% 1.0 0.8% 17.0 5.4% 9.9% Never 43.0 8.5% 2. 1.7% 2 3.0 9.0% 13.0 18.3% Few times year 66.0 13.1% 11.0 9.1% 42.0 13.5% 13.0 18.3% Few times year 202.0 40.1% 41.0 33.9% 127.0 40.7% 34.0 47.9% Once or twice month 111.0 22.0% 25.0 20.7% 64.0 20.5% 22.0 31.0% Once or twice month 161.0 31.9% 43.0 35.5% 106.0 34.0% 12.0 16.9% At least once a week 141.0 28.0% 32.0 26.4% 92.0 29.5% 17.0 23.9% At least once a week 78.0 15.5% 28.0 23.1% 41.0 13.1% 9.0 12.7% Almost everyday 159.0 31.5% 52.0 43.0% 96.0 30.8% 11.0 15.5% Almost everyday 19.0 3.8% 7.0 5.8% 9.0 2.9% 3.0 4.2% Not counting work for school or a job, about how many hours a week do you spend online--browser, social media, video streaming, etc. Which of the following best characterizes your phone use? Total High Medium Low Total High Medium Low Count Count % Count Count Count Count % Count % Count Less than 1 hour 17.0 3.4% 6.0 5.0% 7.0 2.2% 4.0 5.6% Surfing and Exploring 86.0 17.1% 16.0 13.2% 59.0 18.9% 11.0 15.5% 1-2 hrs 74.0 14.7% 35.0 28.9% 32.0 10.3% 7.0 9.9% Communicating 158.0 31.3% 62.0 51.2% 79.0 25.3% 17.0 23.9% 3-5 hrs 130.0 25.8% 34.0 28.1% 84.0 26.9% 12.0 16.9% Working 20.0 4.0% 0 5.0% 3.5% 4.2% 6-9 hrs 103.0 20.4% 20.0 16.5% 71.0 22.8% 12.0 16.9% Creating 8.0 1.6% 1.0 0.8% 2.0 0.6% 5.0 7.0% 10-19 hours 100.0 19.8% 15.0 12.4% 68.0 21.8% 17.0 23.9% Passing Time 155.0 30.8% 20.0 16.5% 107.0 34.3% 28.0 39.4% 20-29 hours 51.0 10.1% 6.0 5.0% 35.0 11.2% 10.0 14.1% nteracting with Others 47.0 9.3% 11.0 9.1% 32.0 10.3% 4.0 5.6% 30 -39 hours 18.0 3.6% 4.0 3.3% 9.0 2.9% 5.0 7.0% Playing Games 12.0 2.4% 2.0 1.7% 8.0 2.6% 2.0 2.8% 40+ hours 11.0 2.2% 1.0 0.8% 6.0 1.9% 4.0 5.6% Other 17.0 3.4% 2.0 1.7% 14.0 4.5% 1.0 1.4% About how many hours a day do you spend on each of the following activities? Total High Medium Low Avg. hrs Median Avg hrs |Median Avg hrs |Median Avg hrs |Median Gaming PC/Console - Single player 0.71 0.00 0.30 0.00 0.71 0.00 1.37 0.00 Gaming PC/Console - Multiplayer 0.56 0.00 0.21 0.00 0.57 0.00 1.11 0.00 Mobile Gaming App - Single player 0.67 0.00 0.40 0.00 0.60 0.00 1.44 0.00 Mobile Gaming App - Multiplayer 0.35 0.00 0.13 0.00 0.33 0.00 0.81 0.00 Social Media - Scrolling 2.54 2.00 1.85 1.00 2.69 2.00 3.06 2.00 Social Media - Interactive with Other 1.47 1.00 1.12 1.00 1.51 1.00 1.93 0.00 Texting 2.01 1.00 1.88 1.00 1.97 1.00 2.37 1.0 Video Chat 0.92 0.00 0.91 0.00 0.80 0.00 1.49 Television 1.49 0.00 1.41 1.00 1.38 0.00 2.10 0.00 streaming Service 1.86 1.00 1.63 1.00 1.90 1 1.00 2.11 1.00 Homework 5.28 4.00 5.07 4.00 Work 5.19 5.00 6.15 6.00 4.975 5.00 4.00 Pursuing a hobby or talent 1.99 1 1.00 1.82 1.00 1.93 1.00 2.54 1.00 Reading 1.95 2.02 1.00 1.78 2.56 Interacting Socially - Face to Face 4.00 3.00 4.34 3.00 3.80 3.00 4.29 2.00
Step by Step Solution
There are 3 Steps involved in it

Get step-by-step solutions from verified subject matter experts