

Question: sv''on the chart means liquid 2. Using the data in the table below, find the enthalpies of dissolution of A and B at their solubility
sv''on the chart means liquid
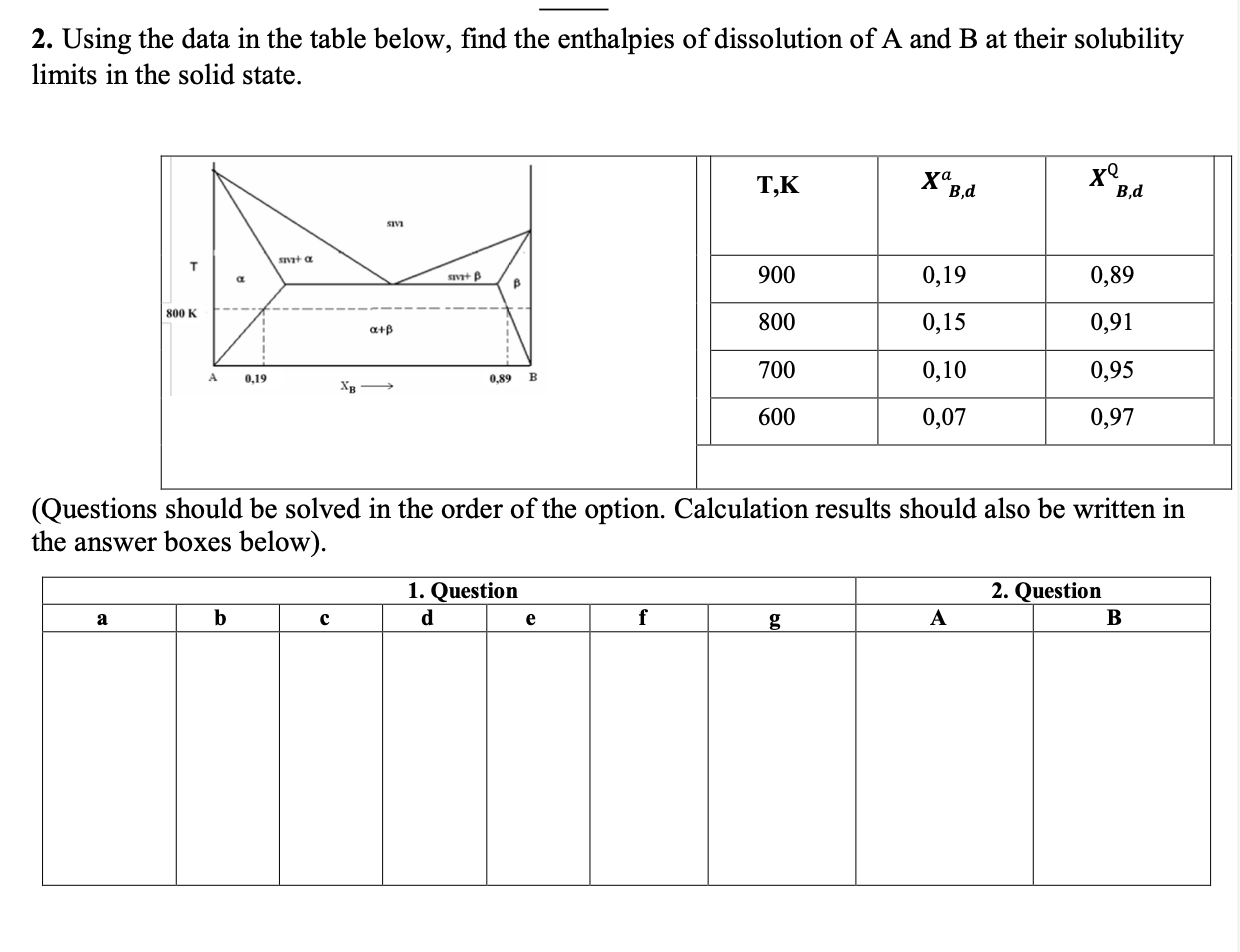
2. Using the data in the table below, find the enthalpies of dissolution of A and B at their solubility limits in the solid state. (Questions should be solved in the order of the option. Calculation results should also be written in the answer boxes below)
Step by Step Solution
There are 3 Steps involved in it
1 Expert Approved Answer
Step: 1 Unlock

Question Has Been Solved by an Expert!
Get step-by-step solutions from verified subject matter experts
Step: 2 Unlock
Step: 3 Unlock