

Question: Switch to the All Types worksheet. Use the Scenario Manager to create a Scenario Summary report that summarizes the effect of the Status Quo, Third
- Switch to the All Types worksheet. Use the Scenario Manager to create a Scenario Summary report that summarizes the effect of the Status Quo, Third Party, and Raise Rates scenarios. Use the range B17:D17 as the result cells.
- Switch back to the All Types worksheet. Use the Scenario Manager as follows to compare the profit per hour in each scenario:
- Create a Scenario PivotTable report for result cells B17:D17.
- Remove the Filter field from the PivotTable.
- Change the Number format of the Profit_Per_Hour_Contracted_Mana, Profit_Per_Hour_Contracted_Chan, and Profit_Per_Hour_Contracted_Proc fields (located in the Values box of the PivotTable Field List) to Currency with 2 Decimal places and $ as the Symbol.
- Use Management as the row label value in cell B3, Change as the value in cell C3, and Process as the value in cell D3.
- In cell A1, use Profit Per Hour Contracted as the report title.
- Format the report title using the Title cell style.
- Resize columns AD to 15.00.
- Add a PivotChart to the Scenario PivotTable worksheet as follows:
- Create a Clustered Column PivotChart based on the PivotTable.
- Resize and reposition the chart so that it covers the range A8:D20.
- Hide the field buttons in the chart. [Mac Hint: The Field Buttons option is not available on Excel 2019 for the Mac, so Mac users can ignore this instruction.]
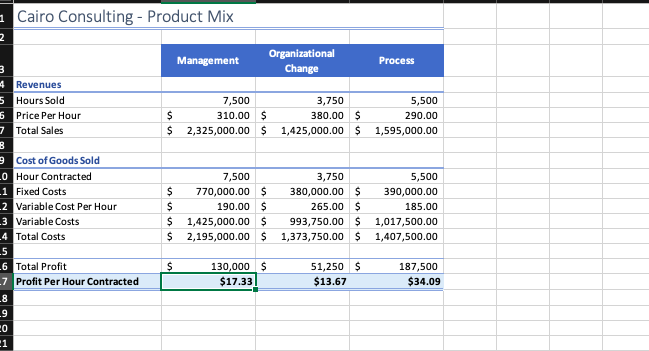
1 Cairo Consulting - Product Mix 2 Management Organizational Change Process $ $ 7,500 310.00 $ 2,325,000.00 $ 3,750 380.00 $ 1,425,000.00 $ 5,500 290.00 1,595,000.00 3 4 Revenues 5 Hours Sold 6 Price Per Hour 7 Total Sales B 9 Cost of Goods Sold 0 Hour Contracted 1 Fixed Costs 2 Variable Cost Per Hour 3 Variable Costs -4 Total Costs -5 -6 Total Profit -7 Profit Per Hour Contracted -8 -9 CO 1 7,500 $ 770,000.00 $ $ 190.00 $ $ 1,425,000.00 $ $ 2,195,000.00 $ 3,750 380,000.00 $ 265.00 $ 993,750.00 $ 1,373,750.00 $ 5,500 390,000.00 185.00 1,017,500.00 1,407,500.00 $ 130,000 $ $17.33 51,250 $ $13.67 187,500 $34.09 1 Cairo Consulting - Product Mix 2 Management Organizational Change Process $ $ 7,500 310.00 $ 2,325,000.00 $ 3,750 380.00 $ 1,425,000.00 $ 5,500 290.00 1,595,000.00 3 4 Revenues 5 Hours Sold 6 Price Per Hour 7 Total Sales B 9 Cost of Goods Sold 0 Hour Contracted 1 Fixed Costs 2 Variable Cost Per Hour 3 Variable Costs -4 Total Costs -5 -6 Total Profit -7 Profit Per Hour Contracted -8 -9 CO 1 7,500 $ 770,000.00 $ $ 190.00 $ $ 1,425,000.00 $ $ 2,195,000.00 $ 3,750 380,000.00 $ 265.00 $ 993,750.00 $ 1,373,750.00 $ 5,500 390,000.00 185.00 1,017,500.00 1,407,500.00 $ 130,000 $ $17.33 51,250 $ $13.67 187,500 $34.09
Step by Step Solution
There are 3 Steps involved in it

Get step-by-step solutions from verified subject matter experts