

Question: Systems Analysis & Design with UML EXERCISE 4 - PROCESS MODELING Using Microsoft Visio, individually create the Event Data Flow Diagrams and a System Dataflow
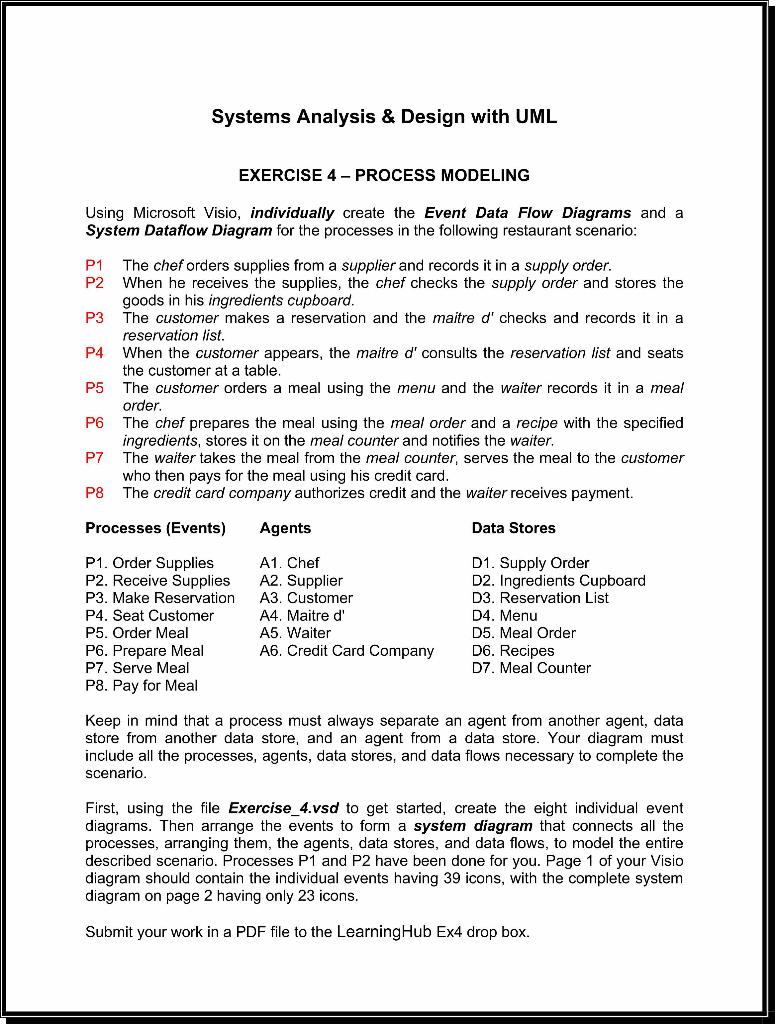
Systems Analysis & Design with UML EXERCISE 4 - PROCESS MODELING Using Microsoft Visio, individually create the Event Data Flow Diagrams and a System Dataflow Diagram for the processes in the following restaurant scenario: P1 The chef orders supplies from a supplier and records it in a supply order. P2 When he receives the supplies, the chef checks the supply order and stores the goods in his ingredients cupboard. P3 The customer makes a reservation and the maitre d' checks and records it in a reservation list. P4 When the customer appears, the maitre d' consults the reservation list and seats the customer at a table. P5 The customer orders a meal using the menu and the waiter records it in a meal order. P6 The chef prepares the meal using the meal order and a recipe with the specified ingredients, stores it on the meal counter and notifies the waiter. P7 The waiter takes the meal from the meal counter, serves the meal to the customer who then pays for the meal using his credit card. P8 The credit card company authorizes credit and the waiter receives payment. Processes (Events) Agents Data Stores P1. Order Supplies P2. Receive Supplies P3. Make Reservation P4. Seat Customer P5. Order Meal P6. Prepare Meal P7. Serve Meal P8. Pay for Meal A1. Chef A2. Supplier A3. Customer A4. Maitre d' A5 Waiter A6. Credit Card Company D1. Supply Order D2. Ingredients Cupboard D3. Reservation List D4. Menu D5. Meal Order D6. Recipes D7. Meal Counter Keep in mind that a process must always separate an agent from another agent, data store from another data store, and an agent from a data store. Your diagram must include all the processes, agents, data stores, and data flows necessary to complete the scenario. First, using the file Exercise_4.vsd to get started, create the eight individual event diagrams. Then arrange the events to form a system diagram that connects all the processes, arranging them, the agents, data stores, and data flows, to model the entire described scenario. Processes P1 and P2 have been done for you. Page 1 of your Visio diagram should contain the individual events having 39 icons, with the complete system diagram on page 2 having only 23 icons. Submit your work in a PDF file to the Learning Hub Ex4 drop box. Systems Analysis & Design with UML EXERCISE 4 - PROCESS MODELING Using Microsoft Visio, individually create the Event Data Flow Diagrams and a System Dataflow Diagram for the processes in the following restaurant scenario: P1 The chef orders supplies from a supplier and records it in a supply order. P2 When he receives the supplies, the chef checks the supply order and stores the goods in his ingredients cupboard. P3 The customer makes a reservation and the maitre d' checks and records it in a reservation list. P4 When the customer appears, the maitre d' consults the reservation list and seats the customer at a table. P5 The customer orders a meal using the menu and the waiter records it in a meal order. P6 The chef prepares the meal using the meal order and a recipe with the specified ingredients, stores it on the meal counter and notifies the waiter. P7 The waiter takes the meal from the meal counter, serves the meal to the customer who then pays for the meal using his credit card. P8 The credit card company authorizes credit and the waiter receives payment. Processes (Events) Agents Data Stores P1. Order Supplies P2. Receive Supplies P3. Make Reservation P4. Seat Customer P5. Order Meal P6. Prepare Meal P7. Serve Meal P8. Pay for Meal A1. Chef A2. Supplier A3. Customer A4. Maitre d' A5 Waiter A6. Credit Card Company D1. Supply Order D2. Ingredients Cupboard D3. Reservation List D4. Menu D5. Meal Order D6. Recipes D7. Meal Counter Keep in mind that a process must always separate an agent from another agent, data store from another data store, and an agent from a data store. Your diagram must include all the processes, agents, data stores, and data flows necessary to complete the scenario. First, using the file Exercise_4.vsd to get started, create the eight individual event diagrams. Then arrange the events to form a system diagram that connects all the processes, arranging them, the agents, data stores, and data flows, to model the entire described scenario. Processes P1 and P2 have been done for you. Page 1 of your Visio diagram should contain the individual events having 39 icons, with the complete system diagram on page 2 having only 23 icons. Submit your work in a PDF file to the Learning Hub Ex4 drop box
Step by Step Solution
There are 3 Steps involved in it

Get step-by-step solutions from verified subject matter experts