

Question: t 1. (40 points) For the next exercise I use quarterly values of the U.S. Treasury Bills (logs) from 1960:1 to 1991:4. ACF 1.4
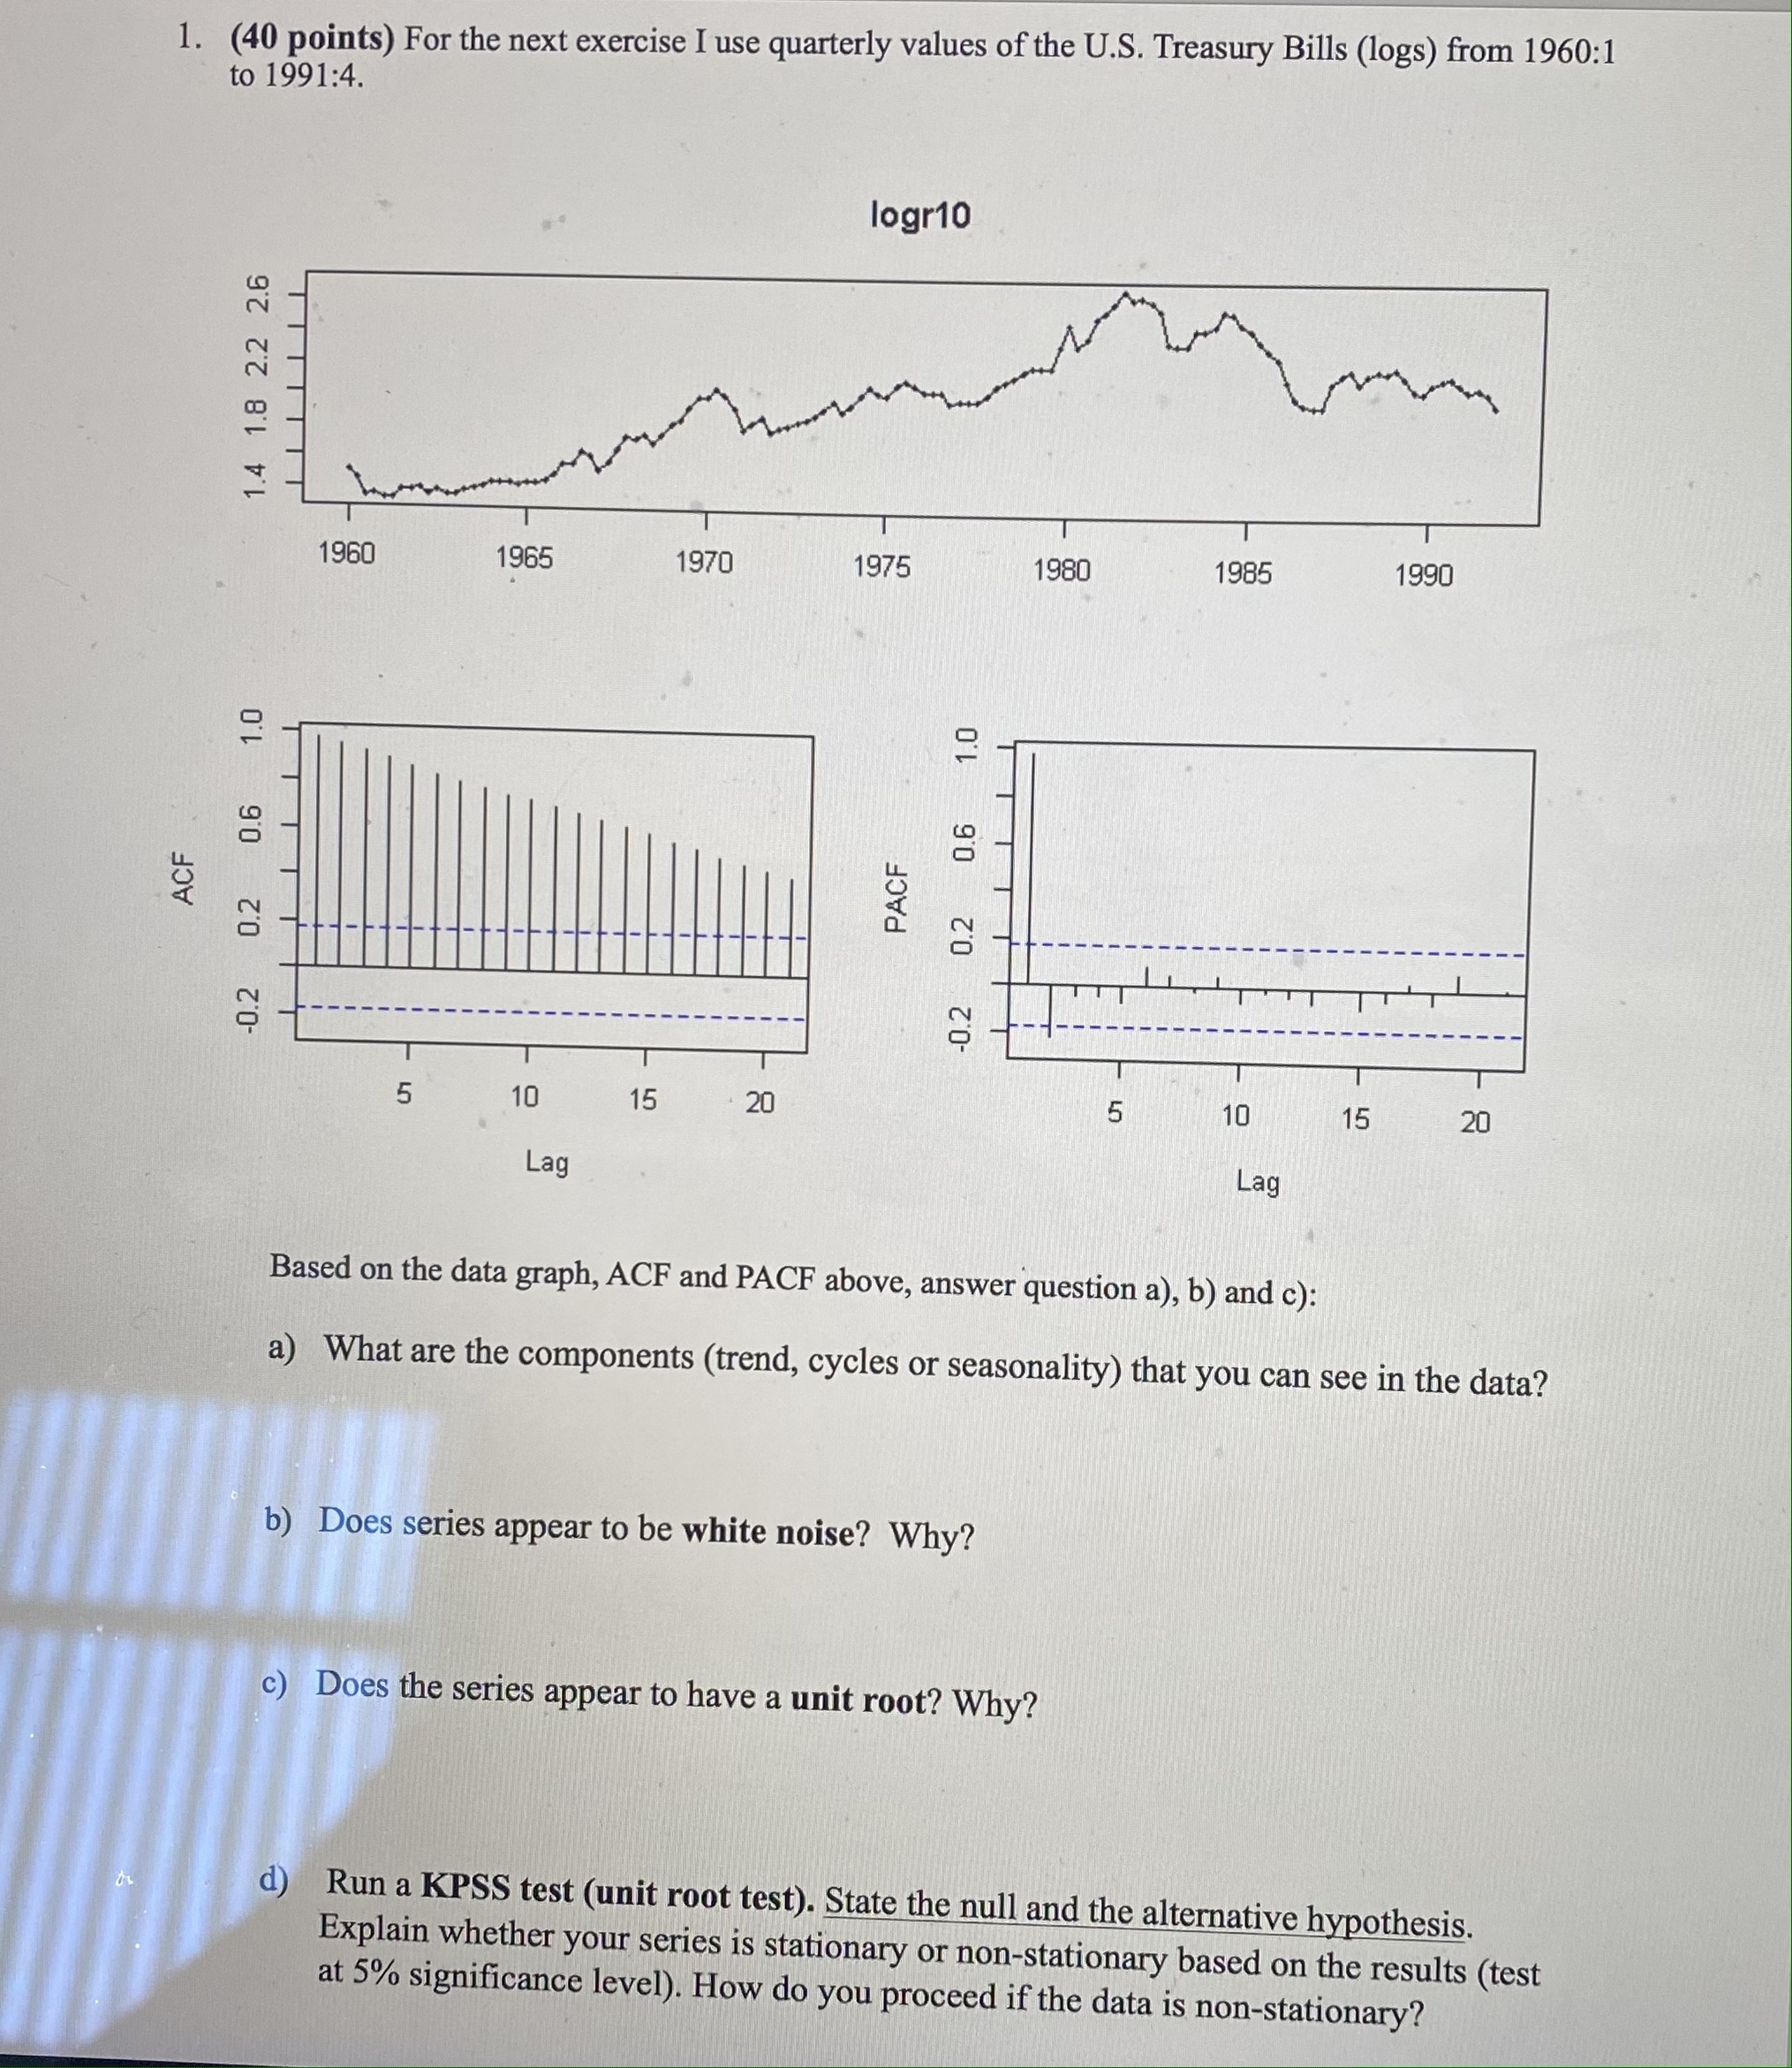
t 1. (40 points) For the next exercise I use quarterly values of the U.S. Treasury Bills (logs) from 1960:1 to 1991:4. ACF 1.4 1.8 2.2 2.6 1.0 0.6 0.2 -0.2 1960 5 1965 10 Lag 15 1970 20 logr10 1975 PACF 1.0 0.6 0.2 -0.2 1980 b) Does series appear to be white noise? Why? 5 c) Does the series appear to have a unit root? Why? 1985 10 Lag 15 1990 Based on the data graph, ACF and PACF above, answer question a), b) and c): a) What are the components (trend, cycles or seasonality) that you can see in the data? 20 d) Run a KPSS test (unit root test). State the null and the alternative hypothesis. Explain whether your series is stationary or non-stationary based on the results (test at 5% significance level). How do you proceed if the data is non-stationary?
Step by Step Solution
There are 3 Steps involved in it
a The components that can be seen in the data are a clear upward trend over time This trend suggests ... View full answer

Get step-by-step solutions from verified subject matter experts