

Question: (T, F) The function below returns the value of False =IF(10 > 9, True, False). (T, F) Goal-seeking analysis is the reverse of what -if
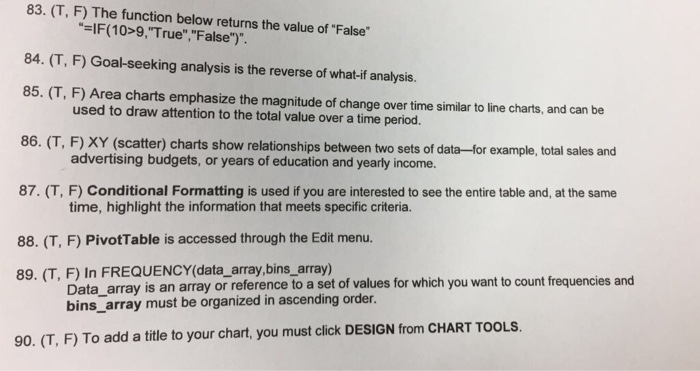
(T, F) The function below returns the value of "False" "=IF(10 > 9, "True", "False")". (T, F) Goal-seeking analysis is the reverse of what -if -analysis. (T, F) Area charts emphasize the magnitude of change over time similar to line charts, and can be used to draw attention to the total value over a time period. (T, F) XY (scatter) charts show relationships between two sets of data- for example, total sales and advertising budgets, or years of education and yearly income. (T, F) Conditional Formatting is used if you are interested to see the entire table and, at the same time, highlight the information that meets specific criteria. (T, F) PivotTable is accessed through the Edit menu. (T, F) In FREQUENCY (data_ array, bins_ array) Data array is an array or reference to a set of values for which you want to count frequencies and bins_ array must be organized in ascending order. (T, F) To add a title to your chart, you must click DESIGN from CHART TOOLS
Step by Step Solution
There are 3 Steps involved in it

Get step-by-step solutions from verified subject matter experts