

Question: T Insert Table Chart Text Shape Media Comment Law of demand: Verbally and graphically describe the Law of Demand. Principle 1 verbally stated as: If

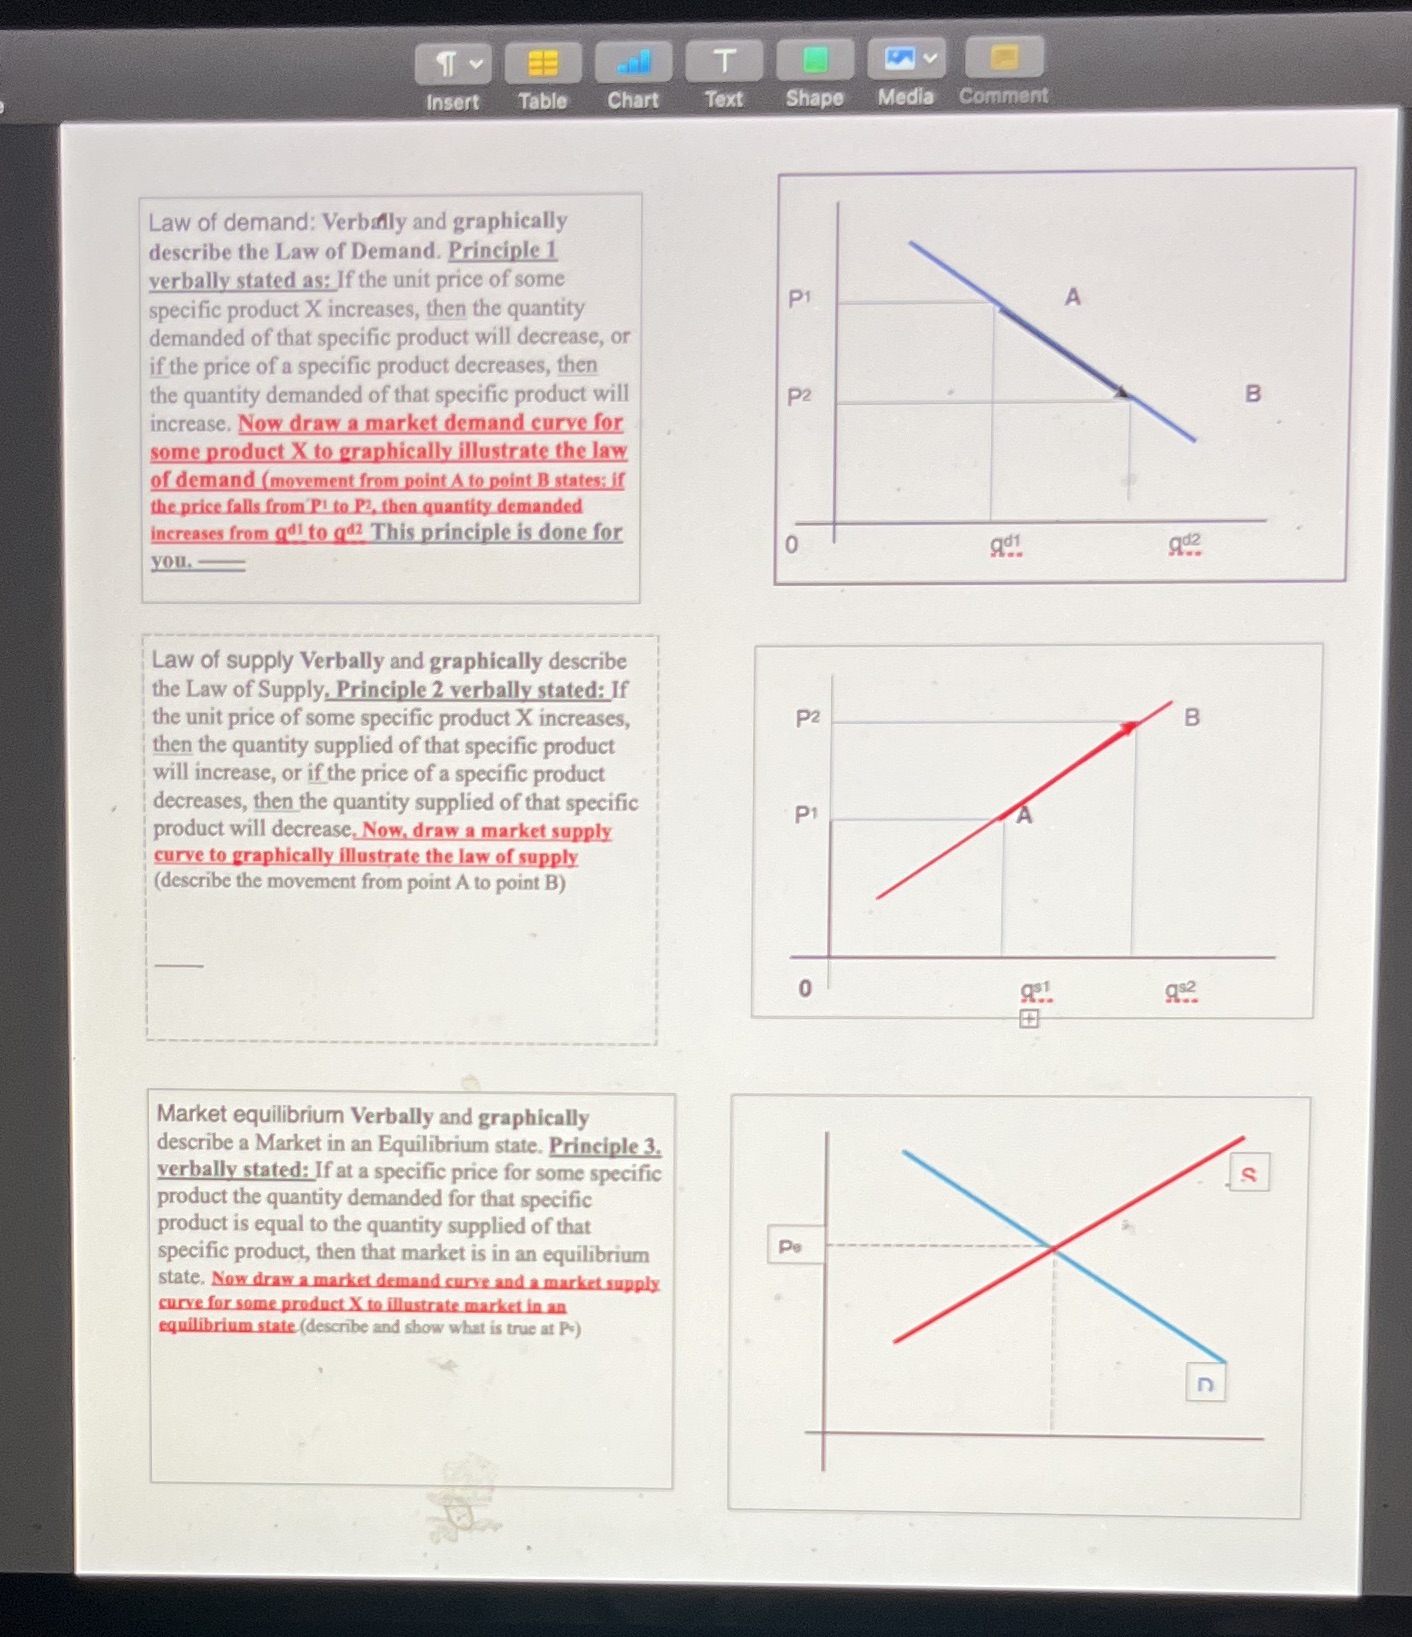
T Insert Table Chart Text Shape Media Comment Law of demand: Verbally and graphically describe the Law of Demand. Principle 1 verbally stated as: If the unit price of some specific product X increases, then the quantity P1 demanded of that specific product will decrease, or if the price of a specific product decreases, then the quantity demanded of that specific product will P2 B increase. Now draw a market demand curve for some product X to graphically illustrate the law of demand (movement from point A to point B states: if the price falls from Pl to P2, then quantity demanded increases from gal to gaz This principle is done for 0 you. Law of supply Verbally and graphically describe the Law of Supply, Principle 2 verbally stated: If the unit price of some specific product X increases, P2 B then the quantity supplied of that specific product will increase, or if the price of a specific product decreases, then the quantity supplied of that specific P1 A product will decrease, Now, draw a market supply curve to graphically illustrate the law of supply (describe the movement from point A to point B) Market equilibrium Verbally and graphically describe a Market in an Equilibrium state. Principle 3. verbally stated: If at a specific price for some specific S product the quantity demanded for that specific product is equal to the quantity supplied of that specific product, then that market is in an equilibrium Pe state. Now draw a market demand curve and a market supply curve for some product X to illustrate market in an equilibrium state (describe and show what is true at P.)
Step by Step Solution
There are 3 Steps involved in it

Get step-by-step solutions from verified subject matter experts