

Question: T R T TR LT e LT e Find the mean, median, and mode of the data. (Section 121 1. Z. Hours Spent on Project
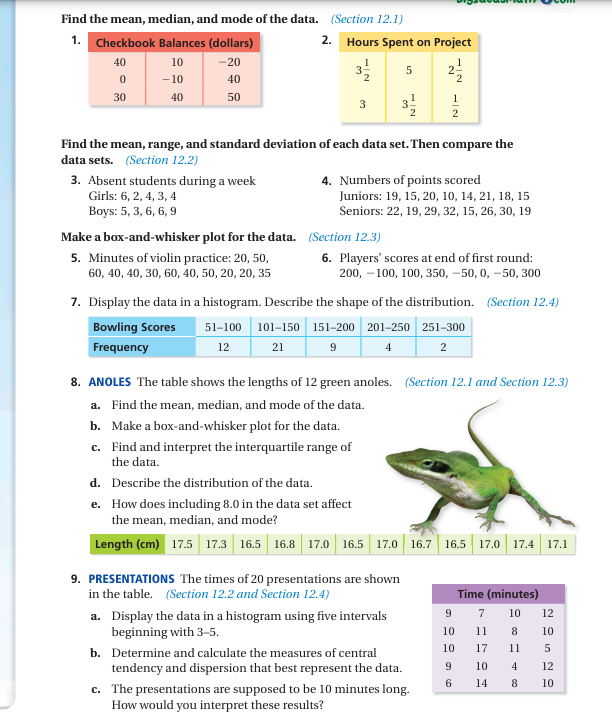
T R T TR LT e LT e Find the mean, median, and mode of the data. (Section 121 1. Z. Hours Spent on Project 1 o 32 3 .-_"E 3 i = 3 2 Find the mean, range, and standard deviation of each data set. Then compare the data sets. (Section 12.2) 3. Absent students during a week 4. Numbers of points scored Girls: 6, 2,4, 3,4 Juniors: 19, 15, 20, 10, 14, 21, 18, 15 Boys: 5,3,6,6,9 Seniors: 22, 19, 29, 32, 15, 26, 30, 19 Make a box-and-whisker plot for the data. (Section 12.3) 5. Minutes of violin practice: 20, 50, 6. Players' scores at end of first round: &0, 40, 40, 30, 60, 40, 50, 20, 20, 35 200, =100, 100, 350, =50, 0, =30, 300 7. Display the data in a histogram. Describe the shape of the distribution. (Section 12.4) Bowling Scores 51-100 | 101-150 | 151-200 | 201-250 | 251-300 Fregquency 12 21 9 4 2 8. ANOLES The table shows the lengths of 12 green anoles. (Section 12.1 and Section 12.3) a. Find the mean, median, and mode of the data. o Make a box-and-whisker plot for the data. c. Find and interpret the interquartile range of the data. d. Describe the distribution of the data. e. How does including 8.0 in the data set affect the mean, median, and mode? Lengthfem) 175 17.3 165 | 168 | 17.0 | 165 17.0 | 16.7 | 165 | 17.0 | 17.4 | 17.1 9. PRESENTATIONS The times of 20 presentations are shown in the table. [(Section 12.2 and Section 12.4) _ a. Display the data in a histogram using five intervals 9 7 W 12 beginning with 3-5. 10 11 8 10 b. Determine and calculate the measures of central o 17 1 3 tendency and dispersion that best represent the data. 3 1o 4 12 14 8 10 c. The presentations are supposed to be 10 minutes long. How would you interpret these results
Step by Step Solution
There are 3 Steps involved in it

Get step-by-step solutions from verified subject matter experts