

Question: table [ [ 1 , 1 , 2 , 3 , 4 , 5 , 6 , 7 , 8 , 9 , 1
table
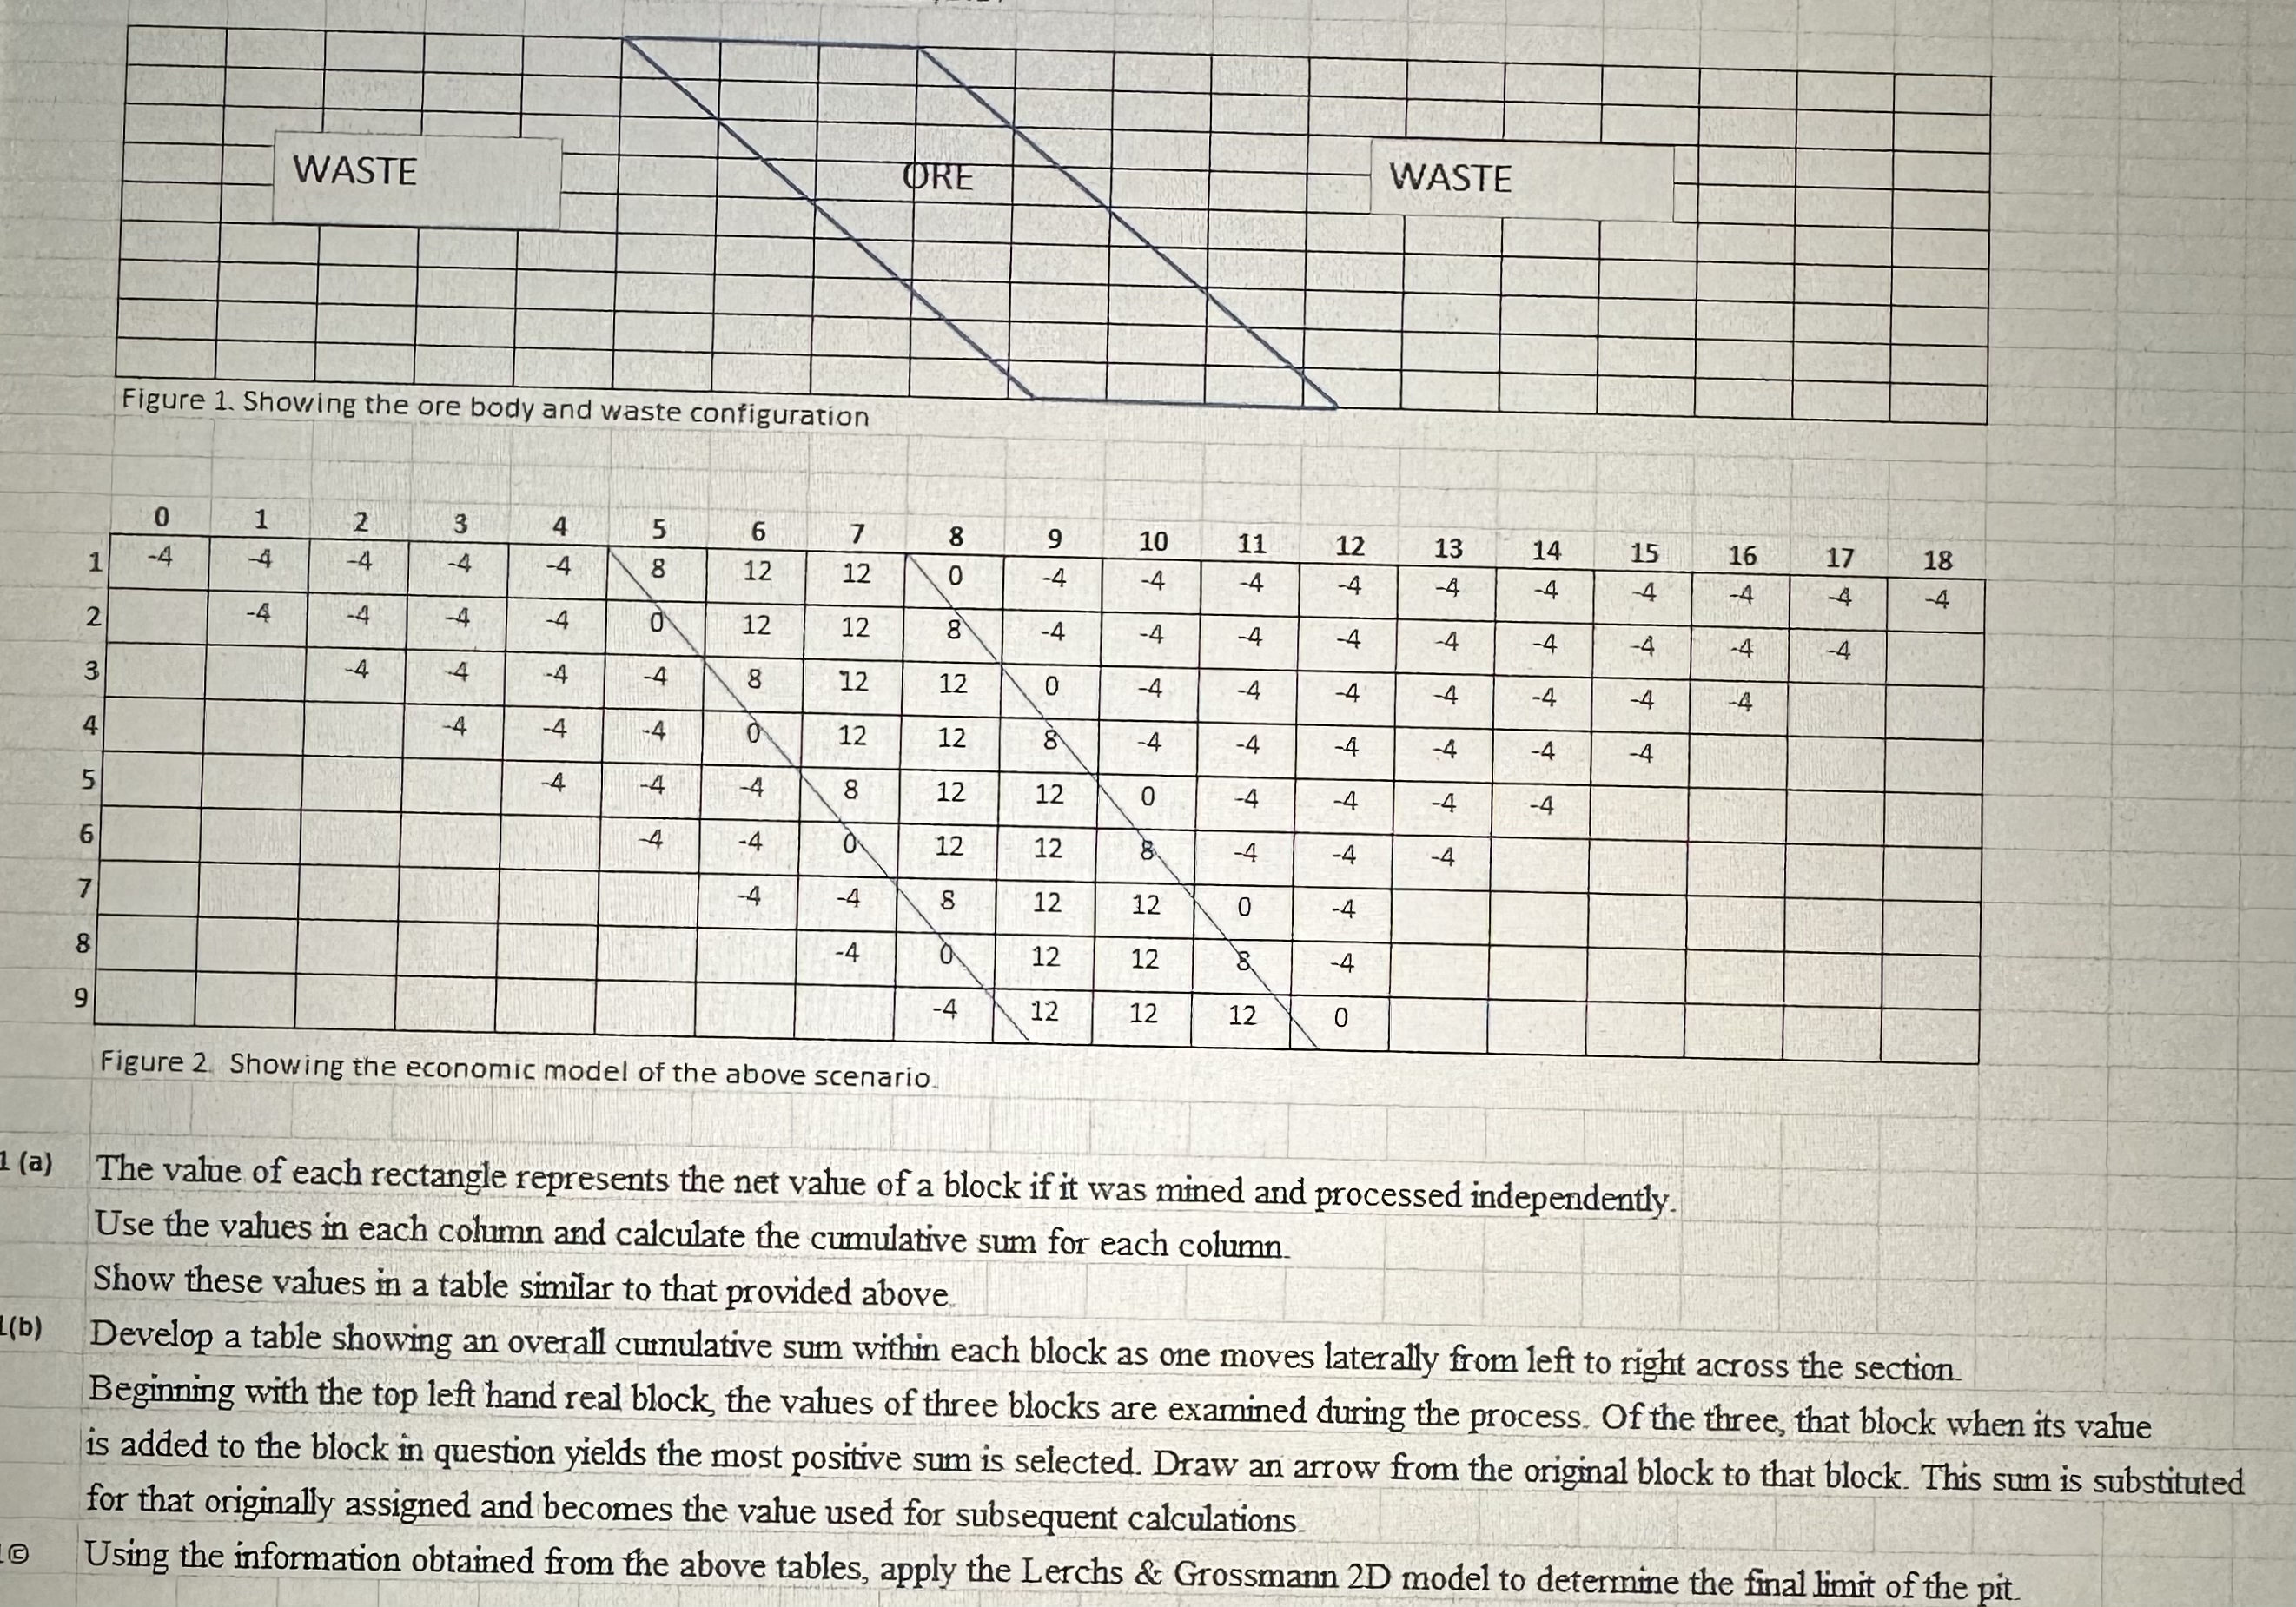
Figure Showing the economic model of the above scenario.
a The value of each rectangle represents the net value of a block if it was mined and processed independently.
Use the values in each column and calculate the cumulative sum for each column.
Show these values in a table similar to that provided above.
b Develop a table showing an overall cumulative sum within each block as one moves laterally from left to right across the section
Beginning with the top left hand real block, the values of three blocks are examined during the process. Of the three, that block when its value is added to the block in question yields the most positive sum is selected. Draw an arrow from the original block to that block. This sum is substituted for that originally assigned and becomes the value used for subsequent calculations.
c Using the information obtained from the above tables, apply the Lerchs & Grossmann D model to determine the final limit of the pit.
Step by Step Solution
There are 3 Steps involved in it
1 Expert Approved Answer
Step: 1 Unlock

Question Has Been Solved by an Expert!
Get step-by-step solutions from verified subject matter experts
Step: 2 Unlock
Step: 3 Unlock