

Question: Table 1, 2 and 3 below provide information on Budgeted Costs, Actual Costs and Percentage of Physical Work Completed (cumulative) relating to a work package.
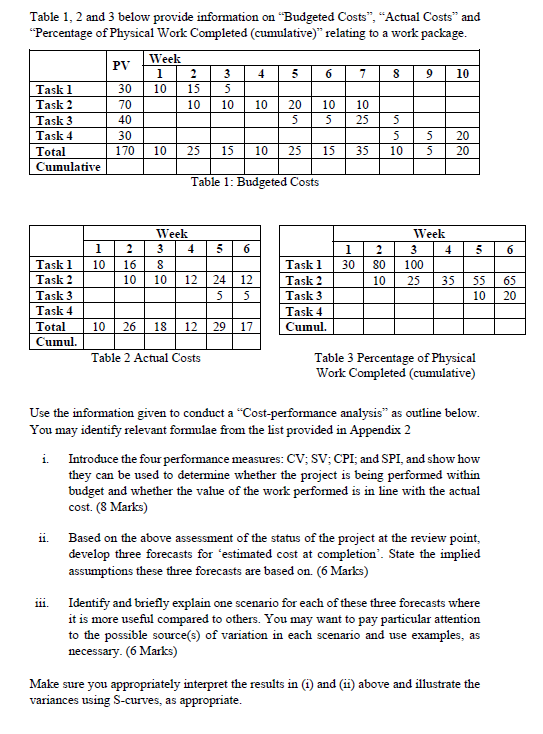
Table 1, 2 and 3 below provide information on "Budgeted Costs, "Actual Costs and "Percentage of Physical Work Completed (cumulative)" relating to a work package. PV Week 1 10 4 5 6 7 8 9 10 2 15 10 5 10 10 30 70 40 30 170 20 5 10 5 Task 1 Task 2 Task 3 Task 4 Total Cumulative 10 25 5 5 10 5 5 10 15 20 20 25 10 25 35 15 Table 1: Budgeted Costs Week 4 5 6 2 5 6 1 10 2 16 1 30 Week 3 4 100 25 35 ol 2 12 80 10 24 5 55 10 Task 1 Task 2 Task 3 Task 4 Cuinul. 65 20 5 Task 1 Task 2 Task 3 Task 4 Total Cuinul. 10 26 18 12 29 17 Table 2 Actual Costs Table 3 Percentage of Physical Work Completed (cumulative) Use the information given to conduct a "Cost-performance analysis as outline below. You may identify relevant formulae from the list provided in Appendix 2 i. Introduce the four performance measures: CV; SV; CPI; and SPI, and show how they can be used to determine whether the project is being performed within budget and whether the value of the work performed is in line with the actual cost. (8 Marks) Based on the above assessment of the status of the project at the review point, develop three forecasts for 'estimated cost at completion'. State the implied assumptions these three forecasts are based on 6 Marks) Identify and briefly explain one scenario for each of these three forecasts where it is more useful compared to others. You may want to pay particular attention to the possible source(s) of variation in each scenario and use examples, as necessary. (6 Marks) 11. 111. Make sure you appropriately interpret the results in (1) and (ii) above and illustrate the variances using S-curves, as appropriate. Table 1, 2 and 3 below provide information on "Budgeted Costs, "Actual Costs and "Percentage of Physical Work Completed (cumulative)" relating to a work package. PV Week 1 10 4 5 6 7 8 9 10 2 15 10 5 10 10 30 70 40 30 170 20 5 10 5 Task 1 Task 2 Task 3 Task 4 Total Cumulative 10 25 5 5 10 5 5 10 15 20 20 25 10 25 35 15 Table 1: Budgeted Costs Week 4 5 6 2 5 6 1 10 2 16 1 30 Week 3 4 100 25 35 ol 2 12 80 10 24 5 55 10 Task 1 Task 2 Task 3 Task 4 Cuinul. 65 20 5 Task 1 Task 2 Task 3 Task 4 Total Cuinul. 10 26 18 12 29 17 Table 2 Actual Costs Table 3 Percentage of Physical Work Completed (cumulative) Use the information given to conduct a "Cost-performance analysis as outline below. You may identify relevant formulae from the list provided in Appendix 2 i. Introduce the four performance measures: CV; SV; CPI; and SPI, and show how they can be used to determine whether the project is being performed within budget and whether the value of the work performed is in line with the actual cost. (8 Marks) Based on the above assessment of the status of the project at the review point, develop three forecasts for 'estimated cost at completion'. State the implied assumptions these three forecasts are based on 6 Marks) Identify and briefly explain one scenario for each of these three forecasts where it is more useful compared to others. You may want to pay particular attention to the possible source(s) of variation in each scenario and use examples, as necessary. (6 Marks) 11. 111. Make sure you appropriately interpret the results in (1) and (ii) above and illustrate the variances using S-curves, as appropriate
Step by Step Solution
There are 3 Steps involved in it

Get step-by-step solutions from verified subject matter experts