

Question: Table 1 3 - 1 Alyson's Pet Sitting Service table [ [ table [ [ Number of ] , [ Workers ] ]
Table
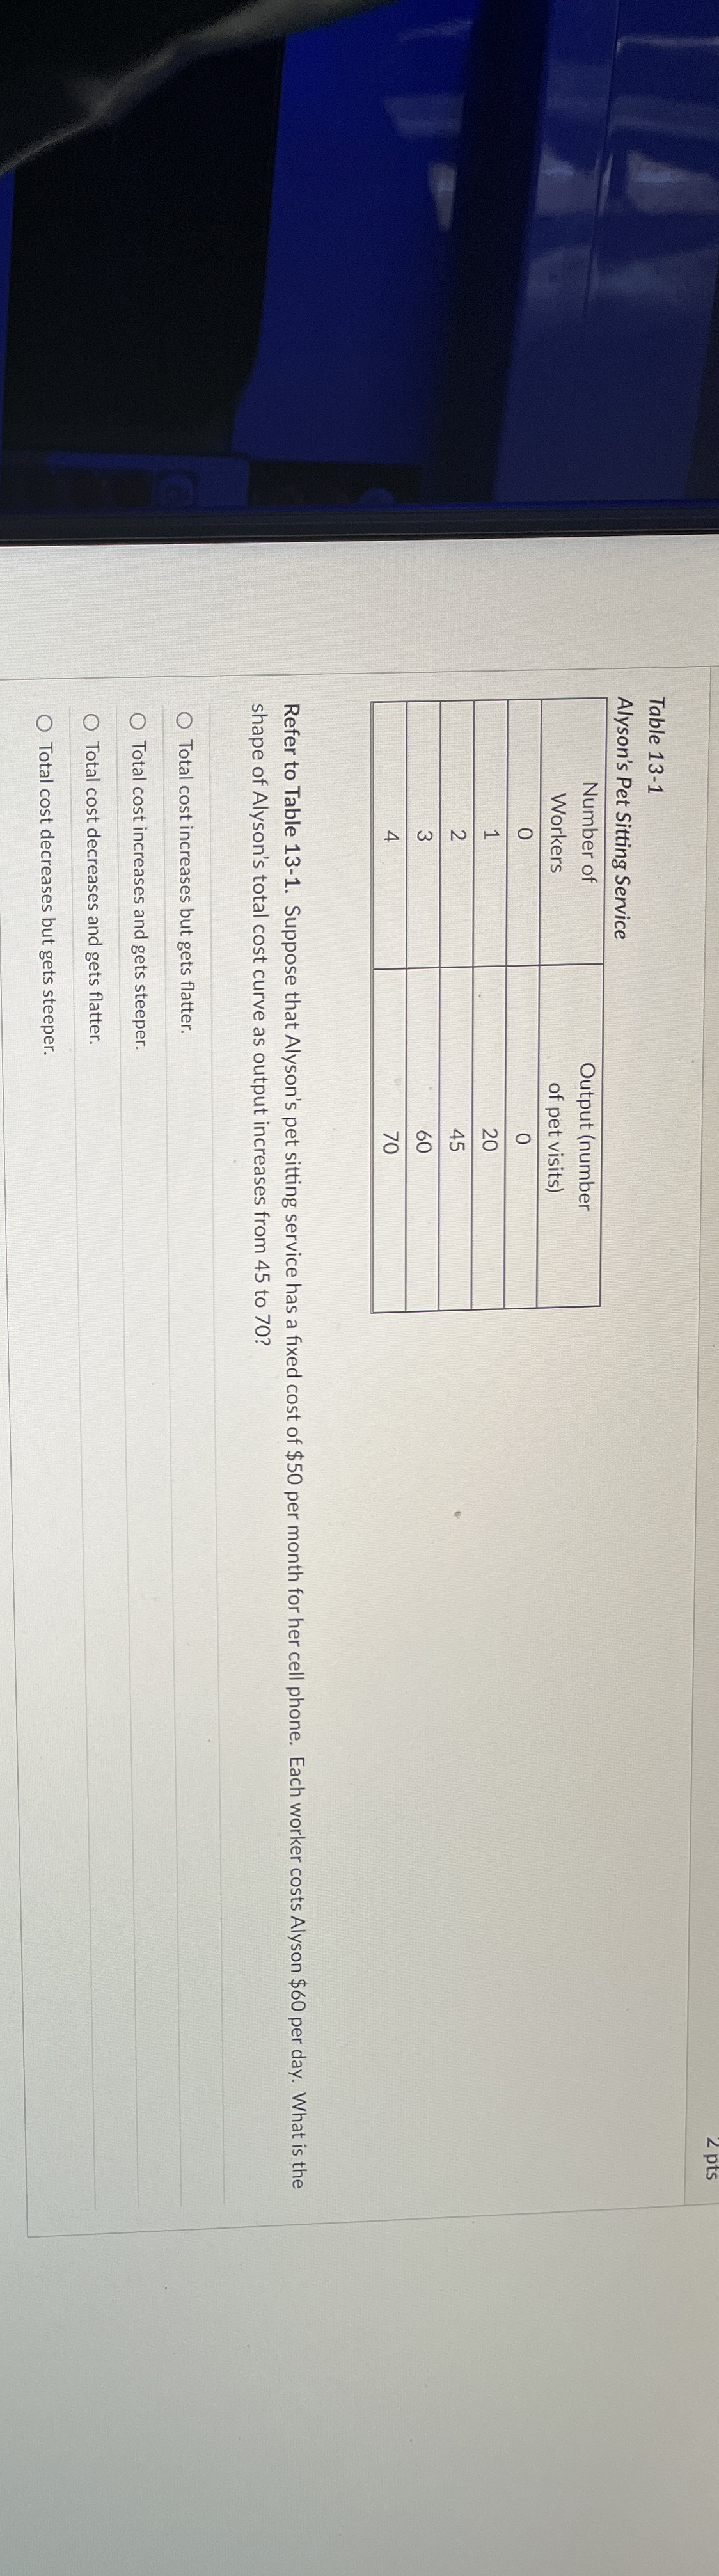
Alyson's Pet Sitting Service
tabletableNumber ofWorkerstableOutput numberof pet visits
Refer to Table Suppose that Alyson's pet sitting service has a fixed cost of $ per month for her cell phone. Each worker costs Alyson $ per day. What is the shape of Alyson's total cost curve as output increases from to
Total cost increases but gets flatter.
Total cost increases and gets steeper.
Total cost decreases and gets flatter.
I cost decreases but gets steeper.
Step by Step Solution
There are 3 Steps involved in it
1 Expert Approved Answer
Step: 1 Unlock

Question Has Been Solved by an Expert!
Get step-by-step solutions from verified subject matter experts
Step: 2 Unlock
Step: 3 Unlock