

Question: Table 1 3 H m 3 9:41 Table 1 McStevens Fruit Farm Possible Output Combinations D Oranges (thousands o kilos) 140 120 100 80 60


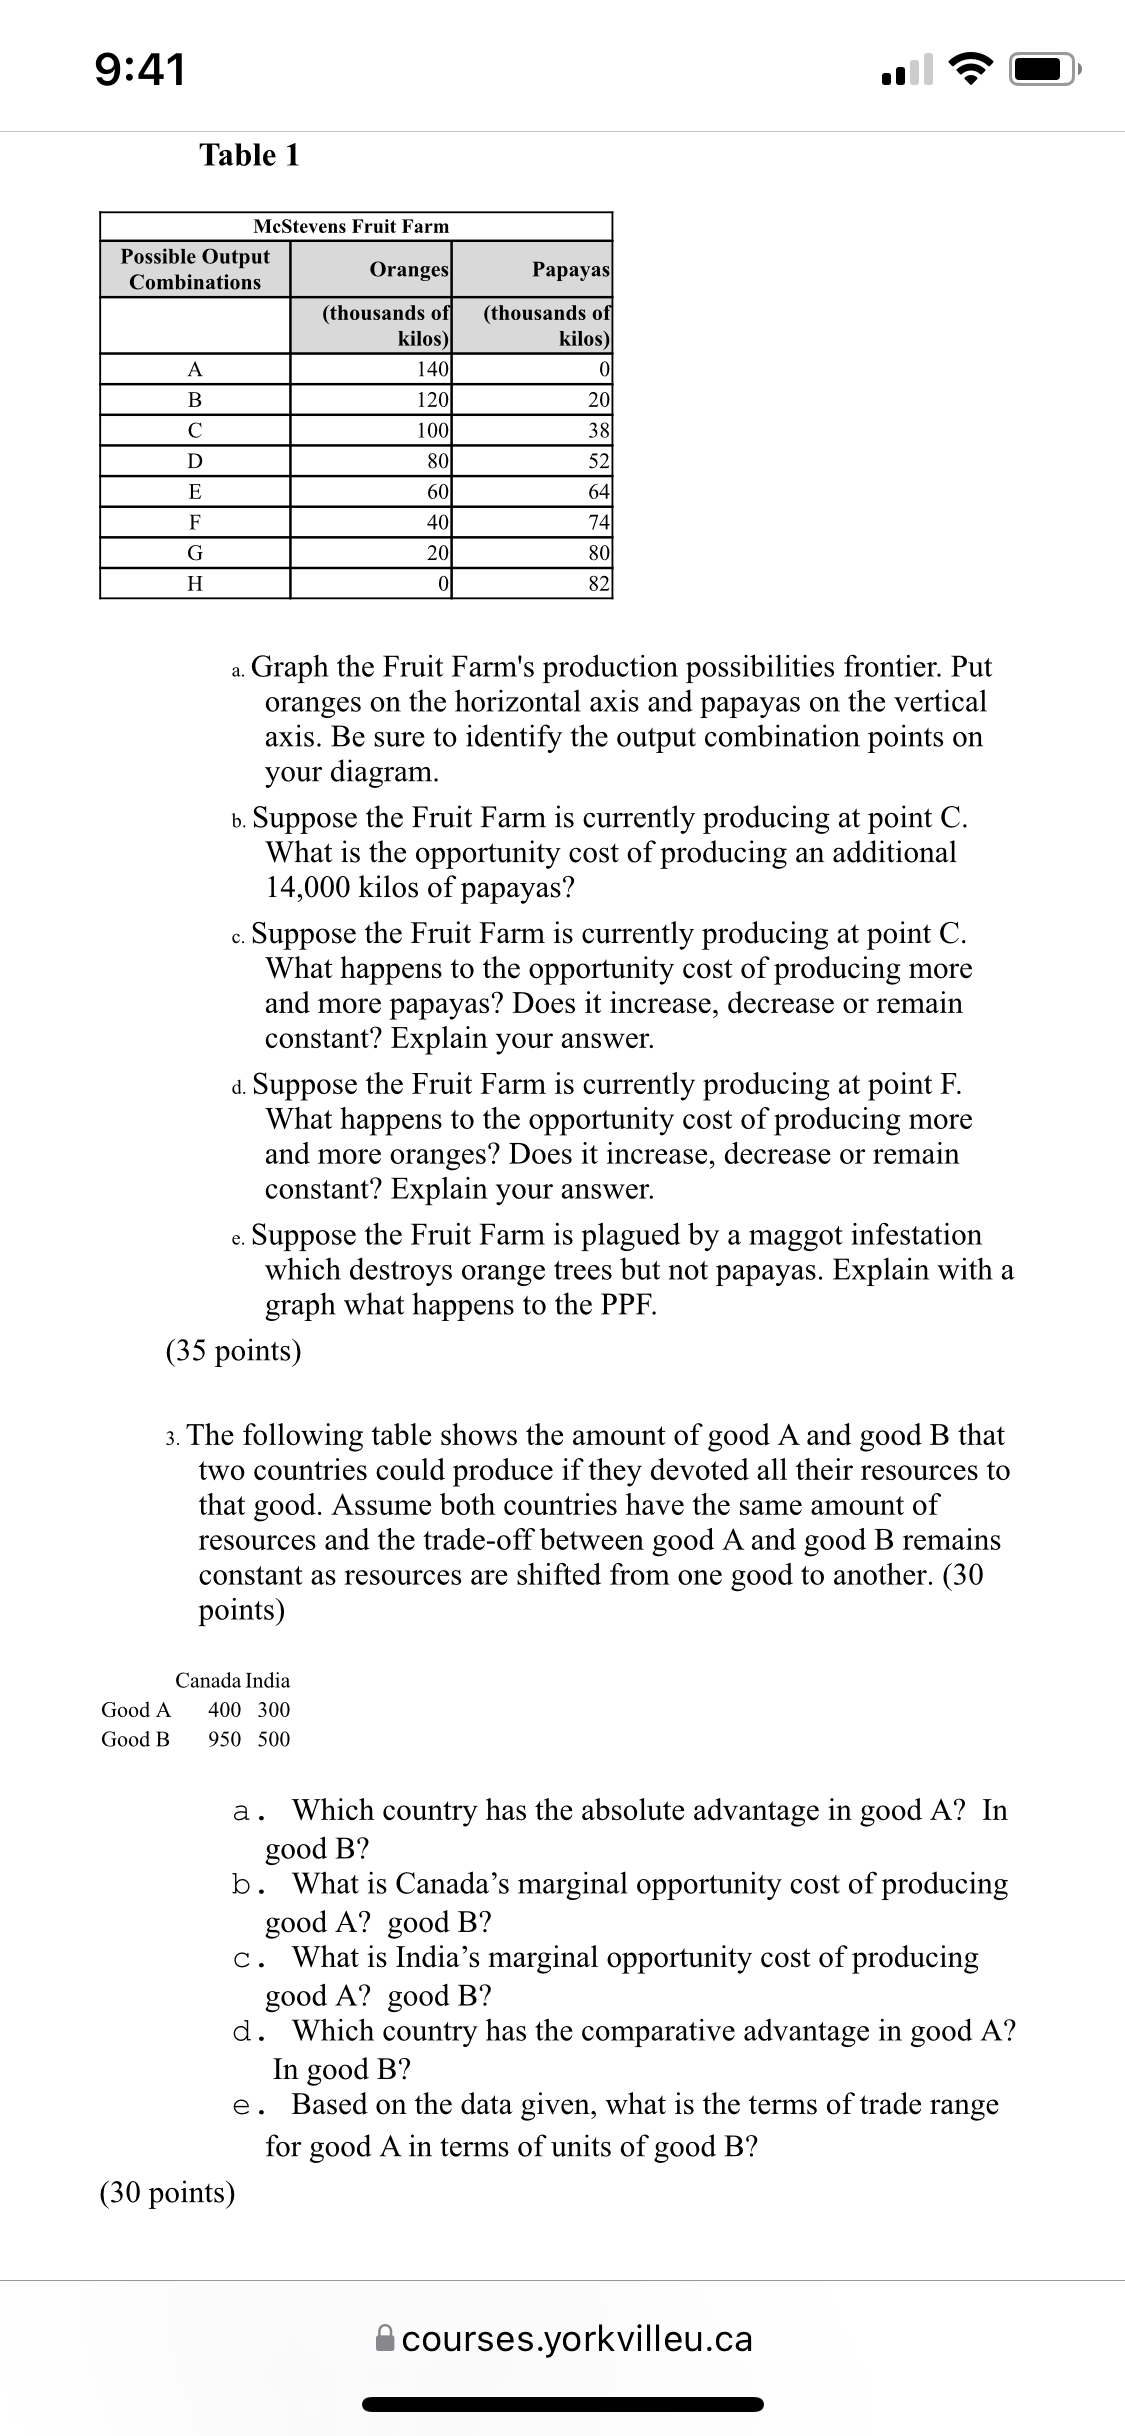
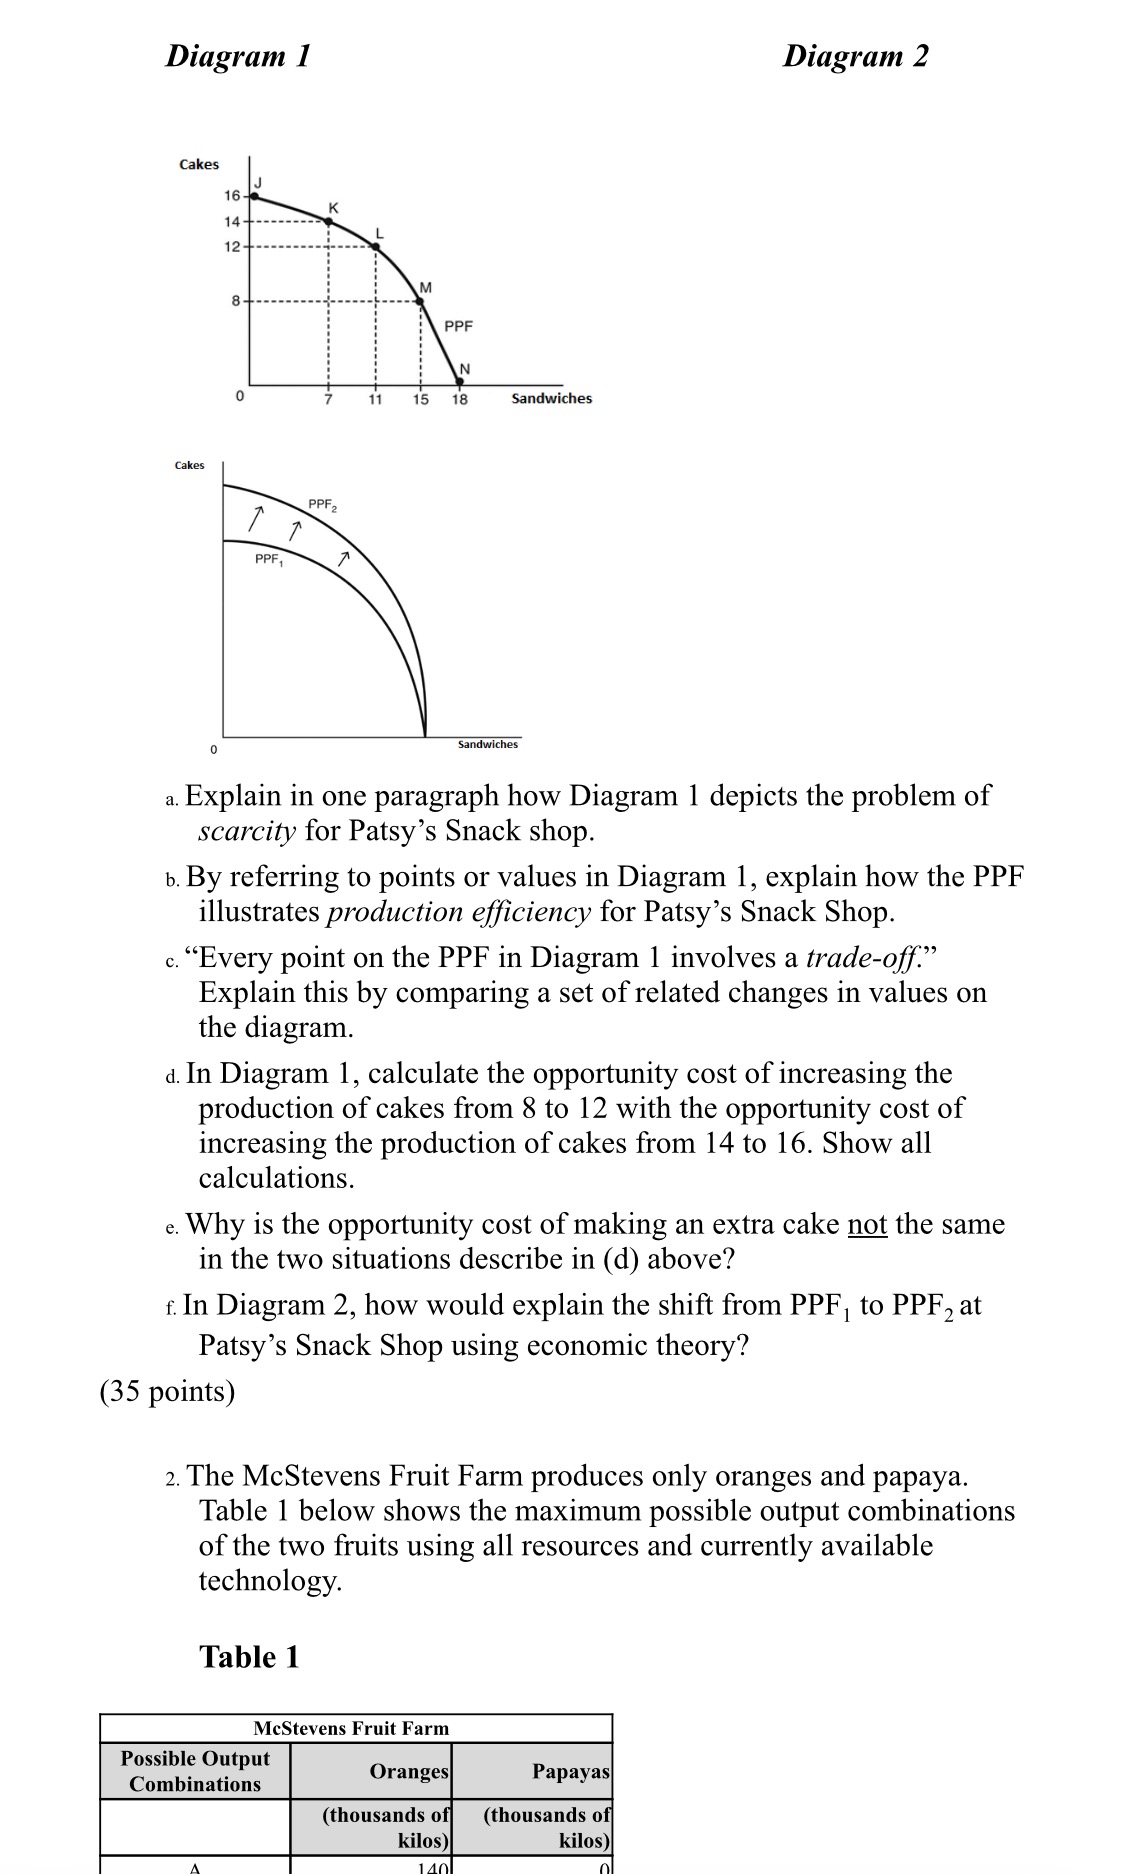
Table 1 3 H m 3
9:41 Table 1 McStevens Fruit Farm Possible Output Combinations D Oranges (thousands o kilos) 140 120 100 80 60 40 20 Papayas (thousands o kilos) 20 38 52 64 74 80 82 a. Graph the Fruit Farm's production possibilities frontier. Put oranges on the horizontal axis and papayas on the vertical axis. Be sure to identify the output combination points on your diagram. b. Suppose the Fruit Farm is currently producing at point C. What is the opportunity cost of producing an additional 14,000 kilos of papayas? c. Suppose the Fruit Farm is currently producing at point C. What happens to the opportunity cost of producing more and more papayas? Does it increase, decrease or remain constant? Explain your answer. d. Suppose the Fruit Farm is currently producing at point F. What happens to the opportunity cost of producing more and more oranges? Does it increase, decrease or remain constant? Explain your answer. e. Suppose the Fruit Farm is plagued by a maggot infestation which destroys orange trees but not papayas. Explain with a graph what happens to the PPF. (35 points) 3 The following table shows the amount of good A and good B that two countries could produce if they devoted all their resources to that good. Assume both countries have the same amount of resources and the trade-off between good A and good B remains constant as resources are shifted from one good to another. (30 points) Canada India Good A 400 300 Good B 950 500 a . Which country has the absolute advantage in good A? In good B? b . What is Canada's marginal opportunity cost of producing good A? good B? c . What is India's marginal opportunity cost of producing good A? good B? d . Which country has the comparative advantage in good A? In good B? e . Based on the data given, what is the terms of trade range for good A in terms of units of good B? (30 points) courses.yorkvilleu.ca
Step by Step Solution
There are 3 Steps involved in it

Get step-by-step solutions from verified subject matter experts