

Question: Table 1. ACT score averages and standard deviations, by sex and race/ethnicity, and percentage of ACT test takers, by selected composite score ranges and planned
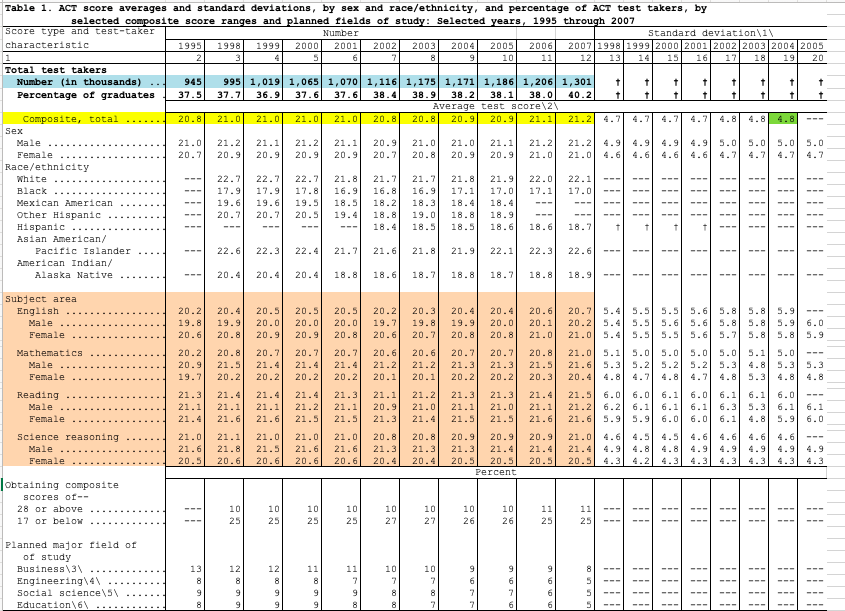
Table 1. ACT score averages and standard deviations, by sex and race/ethnicity, and percentage of ACT test takers, by selected composite score ranges and planned fields of study: Selected years, 1995 through 2007 Score type and test-taker Number standard deviation\\ly characteristic 1995 1998 1999 2000 2001 2002 2003 2004 2005 2006 2007 1998 1999 2000 2001 2002 2003 2004 2005 8 10 11 12 13 14 15 16 17 18 19 20 Total test takers Number (in thousands) 945 995 1, 019 1, 065 1, 070 1, 116 1,175 1,171 1, 186 1,206 1,301 Percentage of graduates 37.5 37.7 36.9 37.6 37 . 6 38.4 38.9 38.2 38 .1 38.0 40.2 Average test 8core\\2' Composite, total 20.8 210 210 21.0| 21.0 20 .8 20.8 20.9 20 .9 21 .1 21 .2 4.7 4.7 4. 7 4.7 4. 8 4.8 4.8 Sex Male . . . . 21 . 0 21.2 21 .1 21.2 21 . 1 20.9 21 . 0 21 . 0 21 . 1 21 .2 21 .2 4.9 4.9 4.9 4.9 5.0 5.0 5 .0 5.0 Female . . . . . . 20 .7 20 .9 20.9 20.9 20.9 20 .7 20 .8 20.9 20.9 21 .0 21 .0 4. 6 4.6 4.6 4. 6 4. 7 4.7 4.7 4.7 Race/ethnicity White 22. 7 22 . 7 22.7 21 .8 21.7 21.7 21 . 8 21.9 22 . 0 22. 1 Black . . . . . . 17.9 17.9 17. 8 16.9 16.8 16.9 17 .1 17.0 17.1 17.0 Mexican American . . . . . . 19.6 19.6 19.5 18.5 18.2 18.3 18.4 18.4 Other Hispanic . .. 20 .7 20 .7 20 .5 19.4 18. 8 19.0 18 . 8 18.9 Hispanic . . 18.4 18 .5 18 .5 18 .6 18.6 18.7 Asian American/ Pacific Islander 22 . 6 22.3 22.4 21 . 7 21 .6 21 .8 21.9 22. 1 22.3 22.6 American Indian, Alaska Native 20 .4 20 .4 20 .4 18 .8 18 .6 18.7 18 .8 18.7 18 .8 18.9 --- Subject area English . . . . . . . . . . 20 .2 20 .4 20.5 20.5 20 .5 20 .2 20 .3 20 .4 20 .4 20 .6 20.7 5.4 5.5 5.5 5-6 5. 8 5. 8 5.9 --- Male . . . . . . . 19.8 19.9 20 .0 20 .0 20 .0 19.7 19.8 19.9 20 .0 20 .1 20.2 5.4 5.5 5.6 5.6 5.9 6.0 Female 20.6 20 .8 20 .9 20.9 20 .8 20 .6 20 .7 20 .8 20 .8 21 .0 21 . 0 5.5 5.5 5.6 5.7 5. 8 5.8 5.9 Mathematics 20.2 20.8 20.7 20.7 20.7 20 .6 20 .6 20 .7 20 .7 20 .8 21 . 0 5.1 5.0 5.0 5.0 5.0 5.1 5.0 Male . . 20.9 21 .5 21 .4 21. 4 21.4 21 .2 21.2 21.3 21.3 21 .5 21. 6 5.3 5.2 5.2 5.2 5.3 4. 8 5.31 5.3 Female 19.7 20.2 20.2 20.2 20 .2 20 .1 20 .1 20 .2 20 .2 20.3 20 .4 4.8 4.7 4.8 4.7 4. 8 5.3 4.8 4.8 Reading 21.3 21 .4 21 .4 21 . 4 21 .3 21 . 1 21 .2 21.3 21 .3 21 .4 21 .5 6 .0 6.0 6.1 6.0 6. 1 6. 1 6.0 Male . . . 21 . 1 21 . 1 21 . 1 21 .2 21. 1 20 .9 21 .0 21.1 21 . 0 21 . 1 21.2 6.2 6.1 6.1 6.1 6.31 5.3 6. 1 6.1 Female 21 .4 21 .6 21.6 21 .5 21 .5 21 .3 21 .4 21 . 5 21 .5 21 .6 21 .61 5.91 5.91 6 .0 6.06 6.1 4.8 5.91 6.0 science reasoning 21 .0 21 .1 21 .0 21 . 0 21 .0 20 .8 20 .8 20 .9 20 .9 20.9 21 . 0 4.6 4.5 4.5 4.6 4.6 4. 6 4.6 Male . . 21 .6 21 . 8 21 .5 21 . 6 21 .6 21 .3 21 .3 21.3 21 .4 21.4 21.4 4.9 4. 8 4.8 4.91 4.9 4.9 4.9 4.9 Female . .. 20.5 20.6 20 .6 20 .6 20 .6 20 .4 20 .4 20 .5 20 .5 20 .5 20 .5 4.3 4.2 4.31 4.3 4.3 4.3 4.3 4.3 Percent obtaining composite scores of-- 28 or above . . 10 10 10 10 10 11 11 17 or below . 25 25 25 Planned major field of of study Business\\3\\ 10 Engineering\\\\ --- D W D N Social science\\ \\ --- Education\\ 6\\
Step by Step Solution
There are 3 Steps involved in it

Get step-by-step solutions from verified subject matter experts