

Question: Table 1. Baseline Patient Characteristics No. (%) Usual Care Variable t-HELP (n = 152)3 (n = 129) Age, mean (SD), y 74.20 (5.53) 75.28 (4.73)
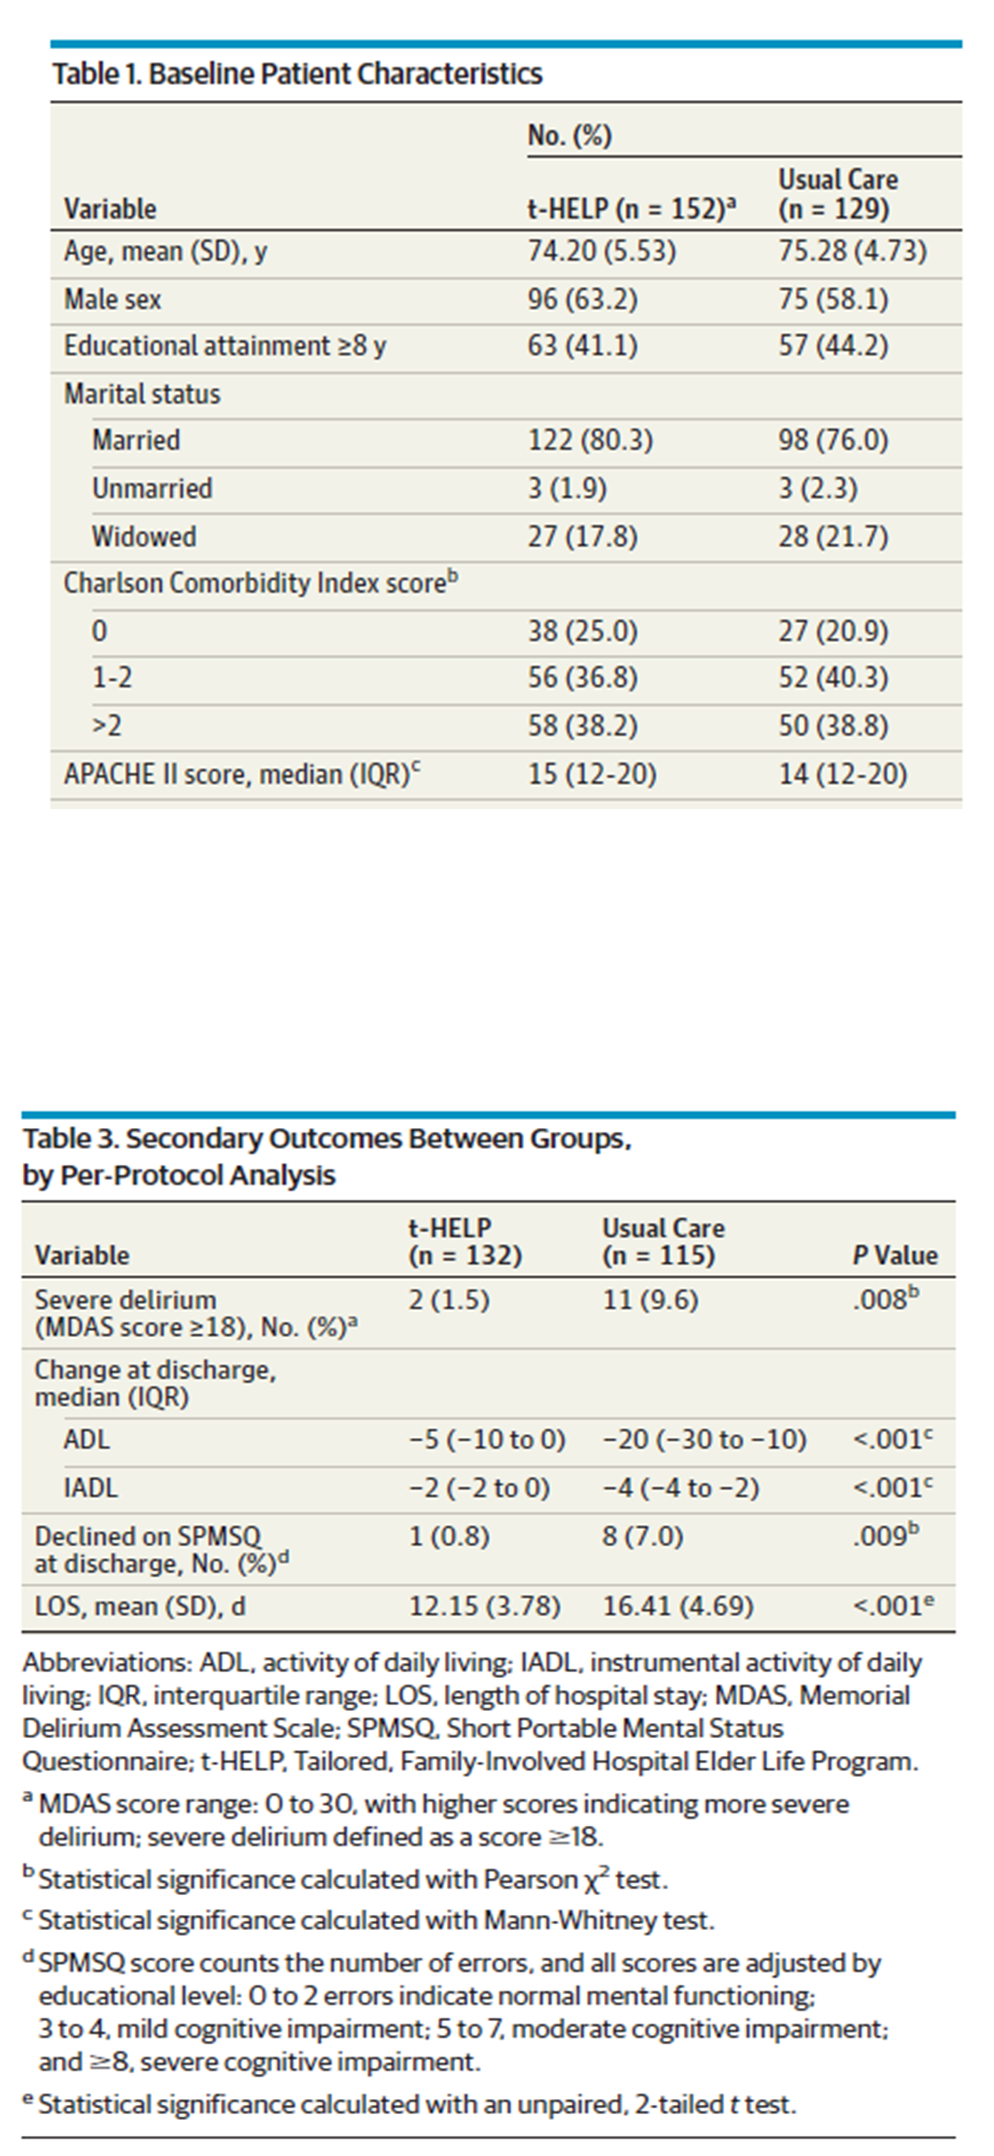
Table 1. Baseline Patient Characteristics No. (%) Usual Care Variable t-HELP (n = 152)3 (n = 129) Age, mean (SD), y 74.20 (5.53) 75.28 (4.73) Male sex 96 (63.2) 75 (58.1) Educational attainment 28 y 63 (41.1) 57 (44.2) Marital status Married 122 (80.3) 98 (76.0) Unmarried 3 (1.9) 3 (2.3) Widowed 27 (17.8) 28 (21.7) Charlson Comorbidity Index scoreb 0 38 (25.0) 27 (20.9) 1-2 56 (36.8) 52 (40.3) >2 58 (38.2) 50 (38.8) APACHE II score, median (IQR) 15 (12-20) 14 (12-20) Table 3. Secondary Outcomes Between Groups, by Per-Protocol Analysis t-HELP Usual Care Variable (n = 132) (n = 115) P Value Severe delirium 2 (1.5) 11 (9.6) .008 (MDAS score 218), No. (%) Change at discharge, median (IQR) ADL -5 (-10 to 0) -20 (-30 to -10) <.0010 iadl to declined on spmsq .009b at discharge no. los mean d abbreviations: adl. activity of daily living: iadl. instrumental iqr interquartile range: length hospital stay: mdas memorial delirium assessment scale: spmsq. short portable mental status questionnaire: t-help. tailored family-involved elder life program. score o with higher scores indicating more severe defined as a statistical significance calculated pearson x test. mann-whitney counts the number errors and all are adjusted by educational level: indicate normal functioning: mild cognitive impairment moderate impairment: impairment. an unpaired t test>
Step by Step Solution
There are 3 Steps involved in it

Get step-by-step solutions from verified subject matter experts