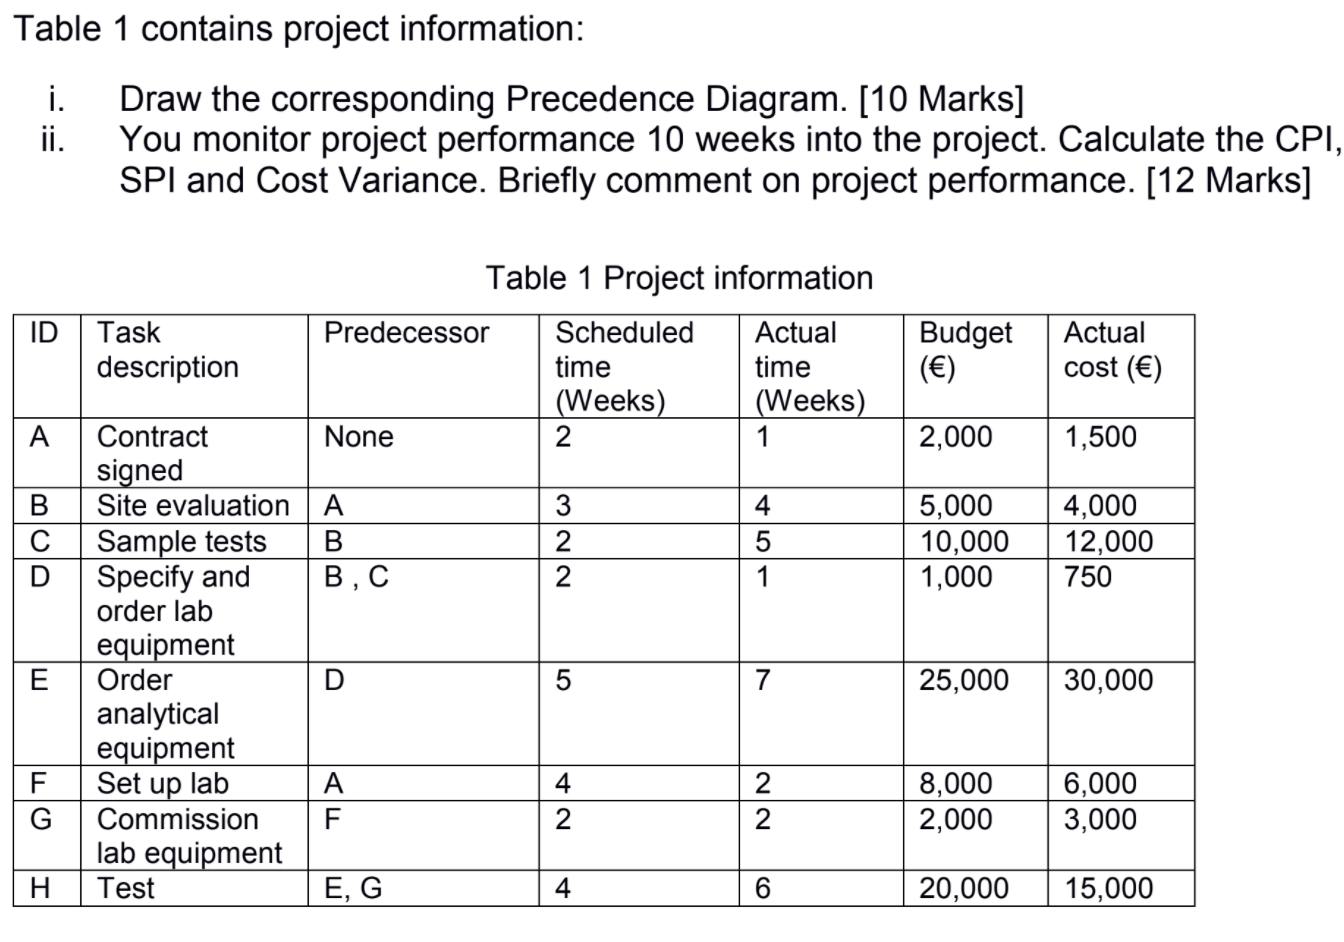
Question: Table 1 contains project information: i. Draw the corresponding Precedence Diagram. [10 Marks] ii. You monitor project performance 10 weeks into the project. Calculate the

Table 1 contains project information: i. Draw the

Table 1 contains project information: i. Draw the corresponding Precedence Diagram. [10 Marks] ii. You monitor project performance 10 weeks into the project. Calculate the CPI, SPI and Cost Variance. Briefly comment on project performance. [12 Marks] ID Budget () Actual cost () A 2,000 1,500 B D Table 1 Project information Task Predecessor Scheduled Actual description time time (Weeks) (Weeks) Contract None 2 1 signed Site evaluation A 3 4 Sample tests B 2 5 Specify and B,C 2 1 order lab equipment Order 5 7 analytical equipment Set up lab A 2 Commission F 2 2 lab equipment Test E, G 6 5,000 10,000 1,000 4,000 12,000 750 E 25,000 30,000 F G 8,000 2,000 6,000 3,000 H . 20,000 15,000

Step by Step Solution

There are 3 Steps involved in it

1 Expert Approved Answer
Step: 1 Unlock blur-text-image
Question Has Been Solved by an Expert!

Get step-by-step solutions from verified subject matter experts

Step: 2 Unlock
Step: 3 Unlock

Students Have Also Explored These Related General Management Questions!