

Question: Table 1 : Data from Soil Samples Gathered Question 2 Based on the data you have entered in Table 1 above, complete the following: A
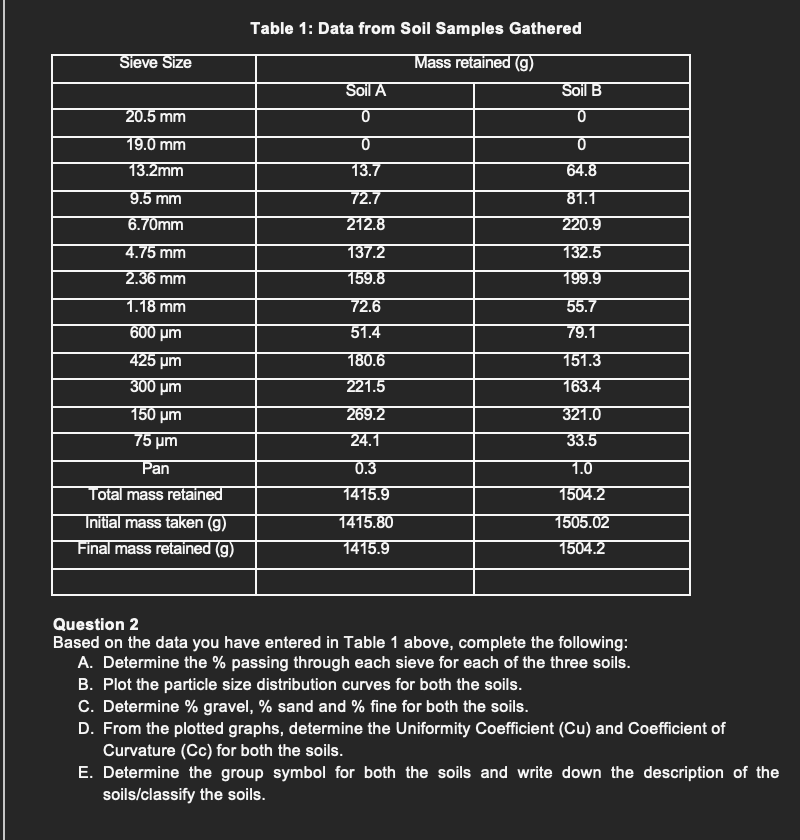
Table : Data from Soil Samples Gathered
Question
Based on the data you have entered in Table above, complete the following:
A Determine the passing through each sieve for each of the three soils.
B Plot the particle size distribution curves for both the soils.
C Determine gravel, sand and fine for both the soils.
D From the plotted graphs, determine the Uniformity Coefficient and Coefficient of
Curvature Cc for both the soils.
E Determine the group symbol for both the soils and write down the description of the
soilsclassify the soils.
please solve whole thing i need retained cumulatative retain finer
Step by Step Solution
There are 3 Steps involved in it
1 Expert Approved Answer
Step: 1 Unlock

Question Has Been Solved by an Expert!
Get step-by-step solutions from verified subject matter experts
Step: 2 Unlock
Step: 3 Unlock