

Question: Table 1 Data of do, d;, ho . h, m. f of a converging lens Object Lens Calculation PL PI Image f value (light source)
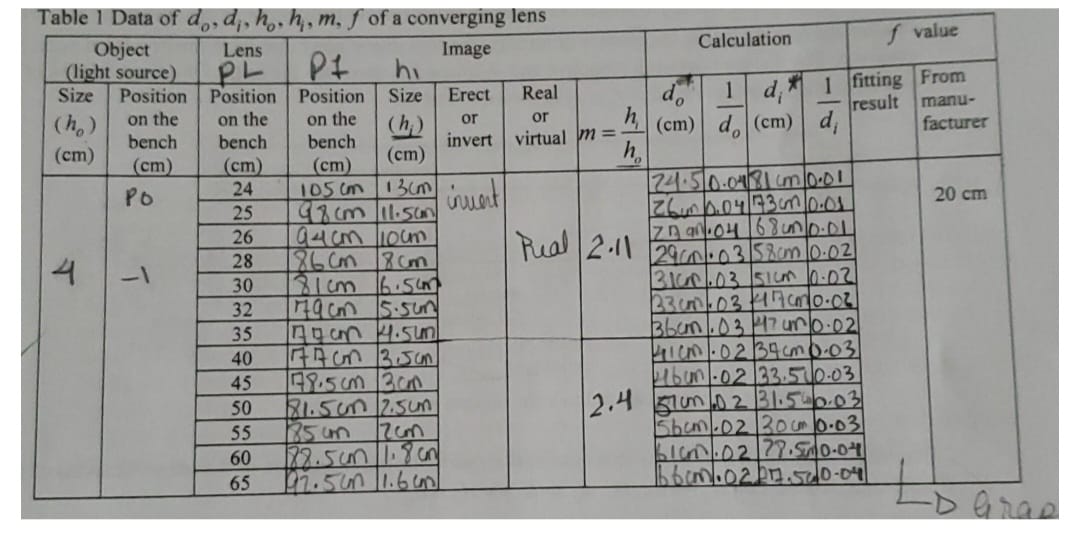
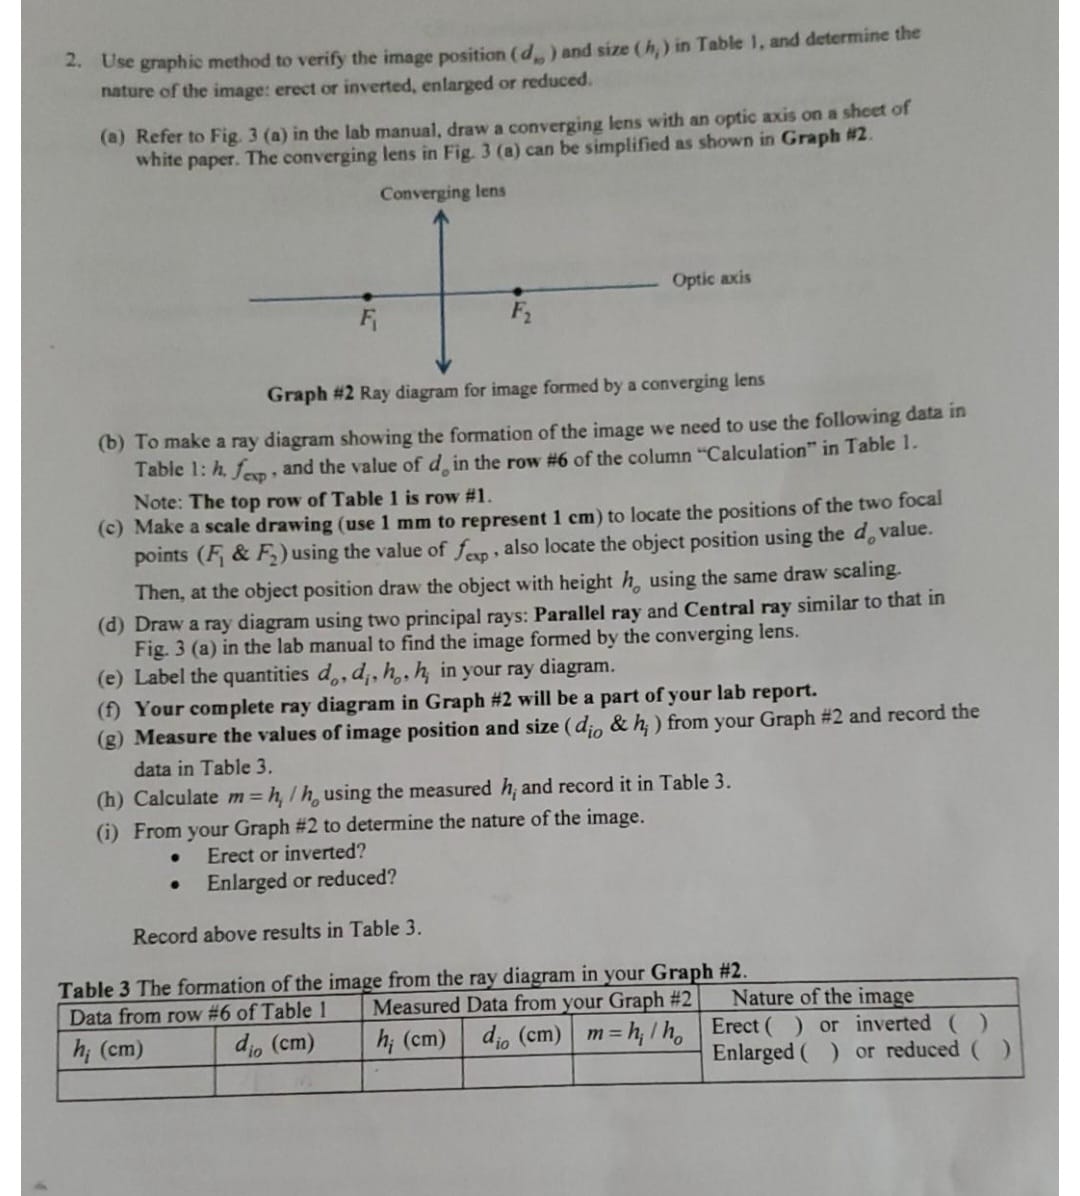
Table 1 Data of do, d;, ho . h, m. f of a converging lens Object Lens Calculation PL PI Image f value (light source) hi Size Position Position Position Size Erect Real 1 fitting From do 1 (ho ) on the on the on the manu- or or h, result (h) (cm) do (cm) d facturer (cm) bench bench bench invert virtual m = (cm) (cm) (cm) (cm) h PO 24 105 (m 13 (m 24.5 0.041 81 (m/D.D1 25 9% cm il.sun invent 20 cm 26 4 28 Pual 2.11 7090.04 168un /D.DL 29 m . 03 58cm |0 . 02 -1 86 Cm RCm 30 8 1 cm 16. 5 LX 32 35 1gan 4.5um 3bun . 03 17 un 0 .02 40 Im . 02 34 (m 0.03 45 98.5 cm arm 41bun . 02 33.51 10.03 50 2.4 5lun .D 2 31.5 - 0.03 55 Sham . 02 30 (m 10.03 60 172. 5um .8 an blunt . 02 79.570.04 65 27. 5 in 1.6 (m2. Use graphic method to verify the image position (d, ) and size (h, ) in Table 1, and determine the nature of the image: erect or inverted, enlarged or reduced (a) Refer to Fig. 3 (a) in the lab manual, draw a converging lens with an optic axis on a sheet of white paper. The converging lens in Fig. 3 (a) can be simplified as shown in Graph #2. Converging lens Optic axis F Graph #2 Ray diagram for image formed by a converging lens (b) To make a ray diagram showing the formation of the image we need to use the following data in Table 1: h, fewp , and the value of d. in the row #6 of the column "Calculation" in Table 1. Note: The top row of Table 1 is row #1. (c) Make a scale drawing (use 1 mm to represent 1 cm) to locate the positions of the two focal points (F, & F2) using the value of fap , also locate the object position using the do value. Then, at the object position draw the object with height h, using the same draw scaling (d) Draw a ray diagram using two principal rays: Parallel ray and Central ray similar to that in Fig. 3 (a) in the lab manual to find the image formed by the converging lens. (e) Label the quantities do, d;, ho, h; in your ray diagram. (f) Your complete ray diagram in Graph #2 will be a part of your lab report. (g) Measure the values of image position and size ( dio & h; ) from your Graph #2 and record the data in Table 3. (h) Calculate m = h, / h, using the measured h, and record it in Table 3. (i) From your Graph #2 to determine the nature of the image. Erect or inverted? Enlarged or reduced? Record above results in Table 3. Table 3 The formation of the image from the ray diagram in your Graph #2 Data from row #6 of Table 1 Measured Data from your Graph #2 Nature of the image h; (cm) dio (cm) h; (cm) dio (cm) m= h, lho Erect ( ) or inverted ( ) Enlarged ( ) or reduced (
Step by Step Solution
There are 3 Steps involved in it

Get step-by-step solutions from verified subject matter experts