

Question: Table 1 Descriptive Statistics Test Value = 50 95% Confidence Interval of the Difference Name 3.054 29 Sig. (2- tailed) .005 Mean Difference 7.367 Lower
Table 1
Descriptive Statistics
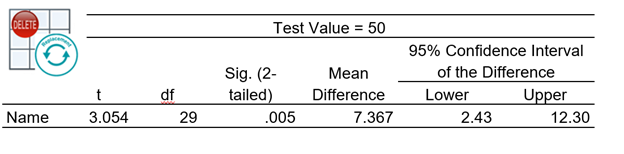
Test Value = 50 95% Confidence Interval of the Difference Name 3.054 29 Sig. (2- tailed) .005 Mean Difference 7.367 Lower 2.43 Upper 12.30
Step by Step Solution
There are 3 Steps involved in it
1 Expert Approved Answer
Step: 1 Unlock

Question Has Been Solved by an Expert!
Get step-by-step solutions from verified subject matter experts
Step: 2 Unlock
Step: 3 Unlock