

Question: Table 1: Descriptive Statistics, GSS 2006 Variable Mean (SD) % Sex (Female) 55.27 Race (Non-White) 27.53 Income (in dollars) 33,049.90 (31,612.53) # of Siblings 3.78
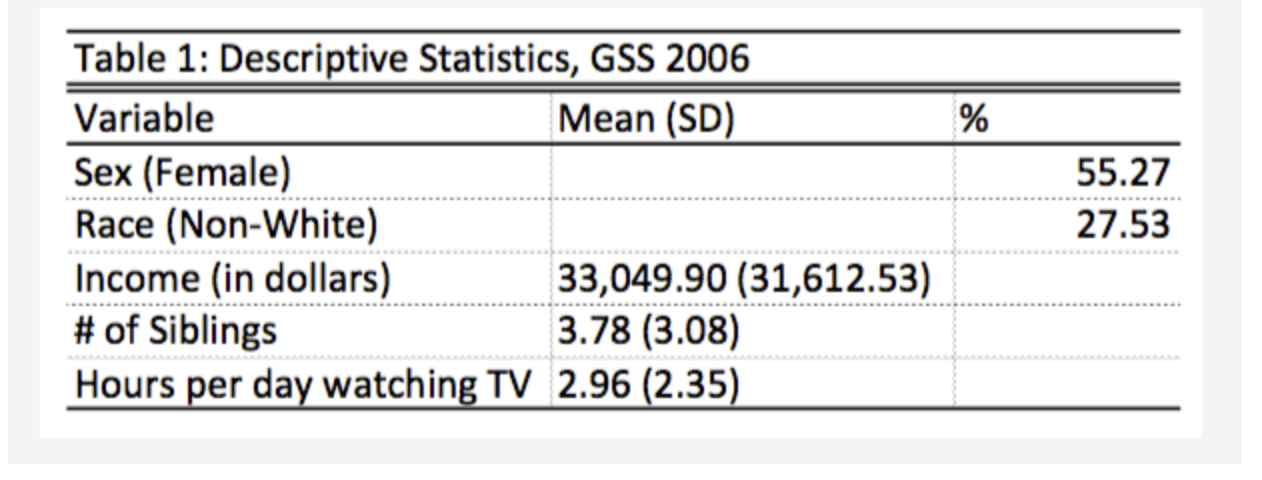
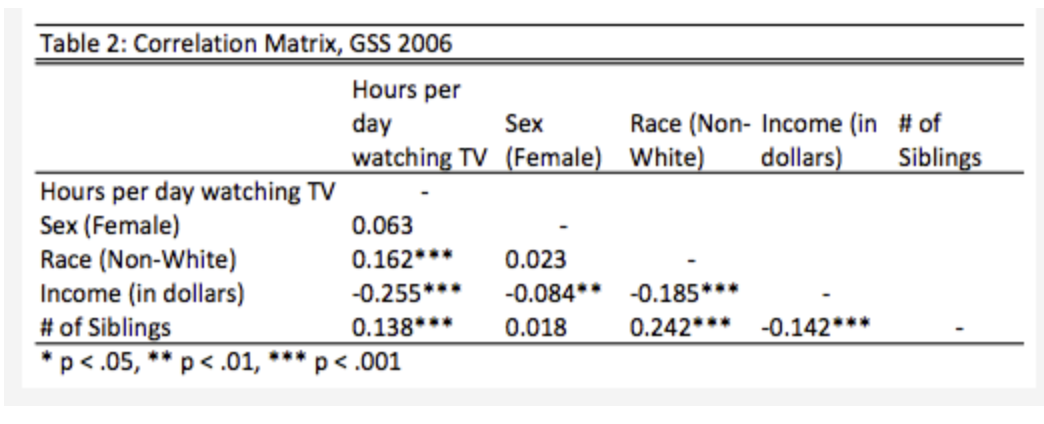
Table 1: Descriptive Statistics, GSS 2006 Variable Mean (SD) % Sex (Female) 55.27 Race (Non-White) 27.53 Income (in dollars) 33,049.90 (31,612.53) # of Siblings 3.78 (3.08) Hours per day watching TV 2.96 (2.35)Table 2: Correlation Matrix, GSS 2006 Hours per day Sex Race (Non- Income (in # of watching TV (Female) White) dollars) Siblings Hours per day watching TV Sex (Female) 0.063 Race (Non-White) 0.162 0.023 Income (in dollars) -0.255' -0.084* * -0.185* # of Siblings 0.138 0.018 0.242* ** -0.142* ** p
Step by Step Solution
There are 3 Steps involved in it
1 Expert Approved Answer
Step: 1 Unlock

Question Has Been Solved by an Expert!
Get step-by-step solutions from verified subject matter experts
Step: 2 Unlock
Step: 3 Unlock