

Question: Table 1: Import Competition and Unemployment a. Interpret the coefficient on Imports in the first column. b. Do a 95% test on the coefficient on
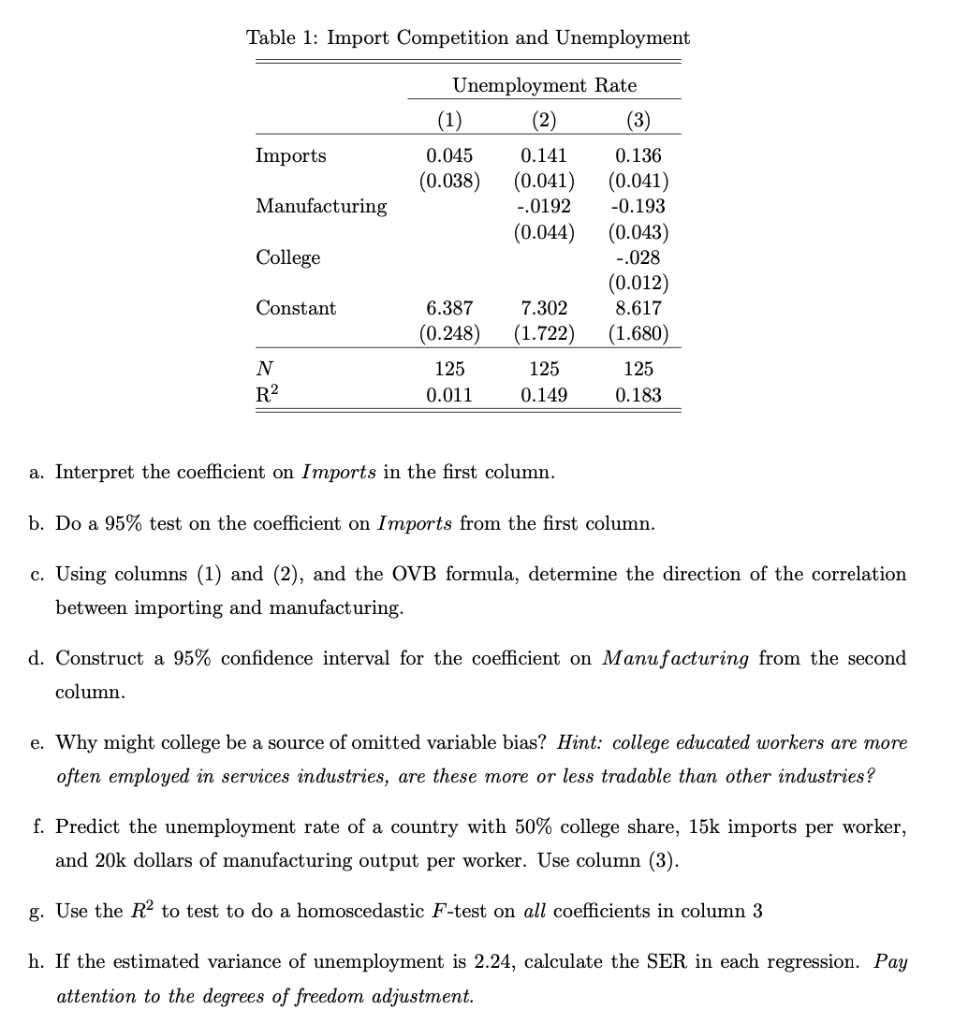
Table 1: Import Competition and Unemployment a. Interpret the coefficient on Imports in the first column. b. Do a 95% test on the coefficient on Imports from the first column. c. Using columns (1) and (2), and the OVB formula, determine the direction of the correlation between importing and manufacturing. d. Construct a 95% confidence interval for the coefficient on Manufacturing from the second column. e. Why might college be a source of omitted variable bias? Hint: college educated workers are more often employed in services industries, are these more or less tradable than other industries? f. Predict the unemployment rate of a country with 50% college share, 15k imports per worker, and 20k dollars of manufacturing output per worker. Use column (3). g. Use the R2 to test to do a homoscedastic F-test on all coefficients in column 3 h. If the estimated variance of unemployment is 2.24, calculate the SER in each regression. Pay attention to the degrees of freedom adjustment
Step by Step Solution
There are 3 Steps involved in it

Get step-by-step solutions from verified subject matter experts