

Question: Table 1 in the attached spreadsheet contains data on the values and transfers for a rural electrification project in a less developed country. The project
Table 1 in the attached spreadsheet contains data on the values and transfers for a rural electrification project in a less developed country. The project will expand a utility grid into a region now lacking electricity service. Currently, the residents use kerosene lamps for lighting. With the expansion of the power grid, residents will switch from kerosene to electric lamps, and also add other electrical appliances, like refrigerators and televisions.
| All Values in "Present Value" Terms ($2006) | |
| Value of Kerosene Displaced (utility customer) | 30 |
| Value of qualitative improvement in electric service and increased electricity consumption (utility customer) | 40 |
| Federal rural development grant (fed->state) | 2 |
| utility operational revenue (utility customer->utility) | 45 |
| monthtly electricity surcharge | 23 |
| utility tax payments (1/2 to fed; 1/2 to state) | 4 |
| new construction worker tax payments (1/2 to fed; 1/2 to state) | 1 |
| displaced construction worker tax payments (1/2 to fed; 1/2 to state) | 1 |
| new operational worker tax payments (1/2 to fed/1/2 to state) | 1 |
| displaced operational worker tax payments (1/2 to fed; 1/2 to state) | 1 |
| new construction worker wage payments (utility->worker) | 5 |
| displaced construction worker wage payment(utility->worker) | 6 |
| new operational worker wage payments (utility->worker) | 6 |
| displaced operational worker wage payment(utility->worker) | 6 |
| Capital Cost Grid Expansion | -15 |
| Time-Loss from newly-employed construction workers | -2 |
| Productivity loss from displaced construction workers | -5 |
| Land cost for utility right-of-way | -5 |
| Non-labor operational cost | -25 |
| time loss for operational workers new | -3 |
| productivity loss from displaced operational workers | -5
|
QUESTIONS;
USE "tableau" BELOW TO DO (Copy and paste this tableau and relabel it Tableau 2. To this tableau, add all of the transfers. Be sure to include the federal government as a stakeholder in this tableau. Re-compute the bottom row net figures, and the right-hand most column figures. Again check for internal consistency, i.e., make sure the sum across the cells in the bottom row is equal to the sum of the cell entries in the right-most column, and all other rows and columns are consistent. Make sure to include a net figure in the bottom right-most cell entry in the tableau
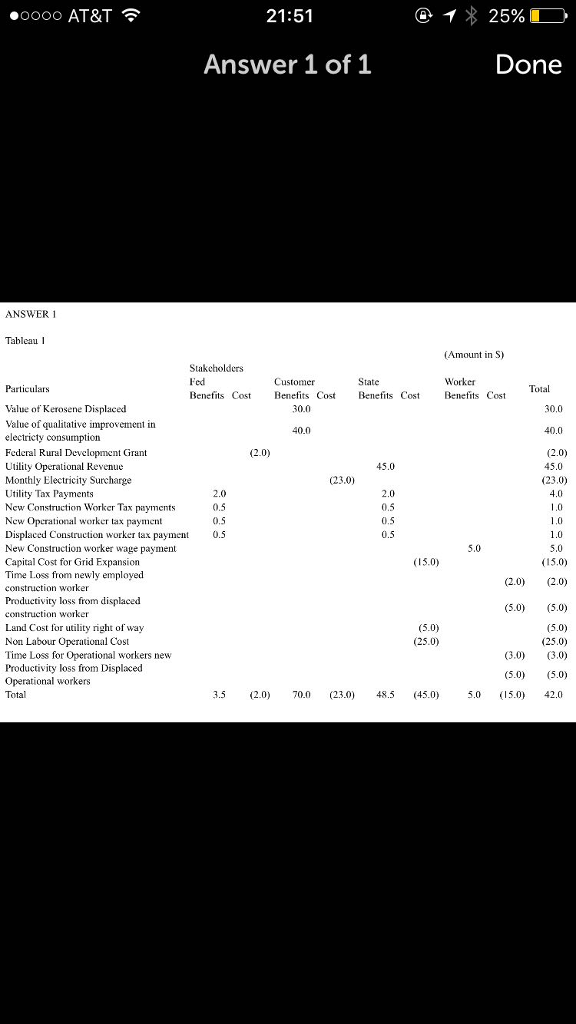
.oooo AT&T 21:51 @% 25% D Answer 1 of 1 Done ANSWER 1 Tableau 1 (Amount in S) Stakcholders Fed Benefits Cost Benefits Cost Bes Cos Benefits Cost Customer State Worker Particulars Total Value of Kerosene Displaced Value of qualitative improvement in electricty Federal Rural Development Grant Utility Operational Revenue Monthly Electricity Surcharge Utility Tax Payments New Construction Worker Tax payments New Opcrational worker tax payment Displaced Construction worker tax payme New Construction worker wage payment Capital Cost for Grid Expansion Time Loss from newly employed construction worker Productivity loss from displaced construction worker 40.0 consump (2.0) (2.0) 45.0 230) 2.0 23.0) 0.5 5.0 (15.0) (15.0) (2.0 2.0) (5.0 5.0) (5.0) (25.0) Land Cost for utility right of way Non Labour Operational Cost Time Loss for Operational workers new Productivity loss from Displaced Operational workers Total (3.0) (3.0) (5.0) 5.0) 3.5 (2.0) 0. (23.0 48.5 (45.0) 5.0 (5.0) 42.0
Step by Step Solution
There are 3 Steps involved in it

Get step-by-step solutions from verified subject matter experts