

Question: Table 1 : Input data for the intersection EBL EBT EBR WBL WBT WBR NBL NBT NBR SBL SBT SBR ? * * the calculated
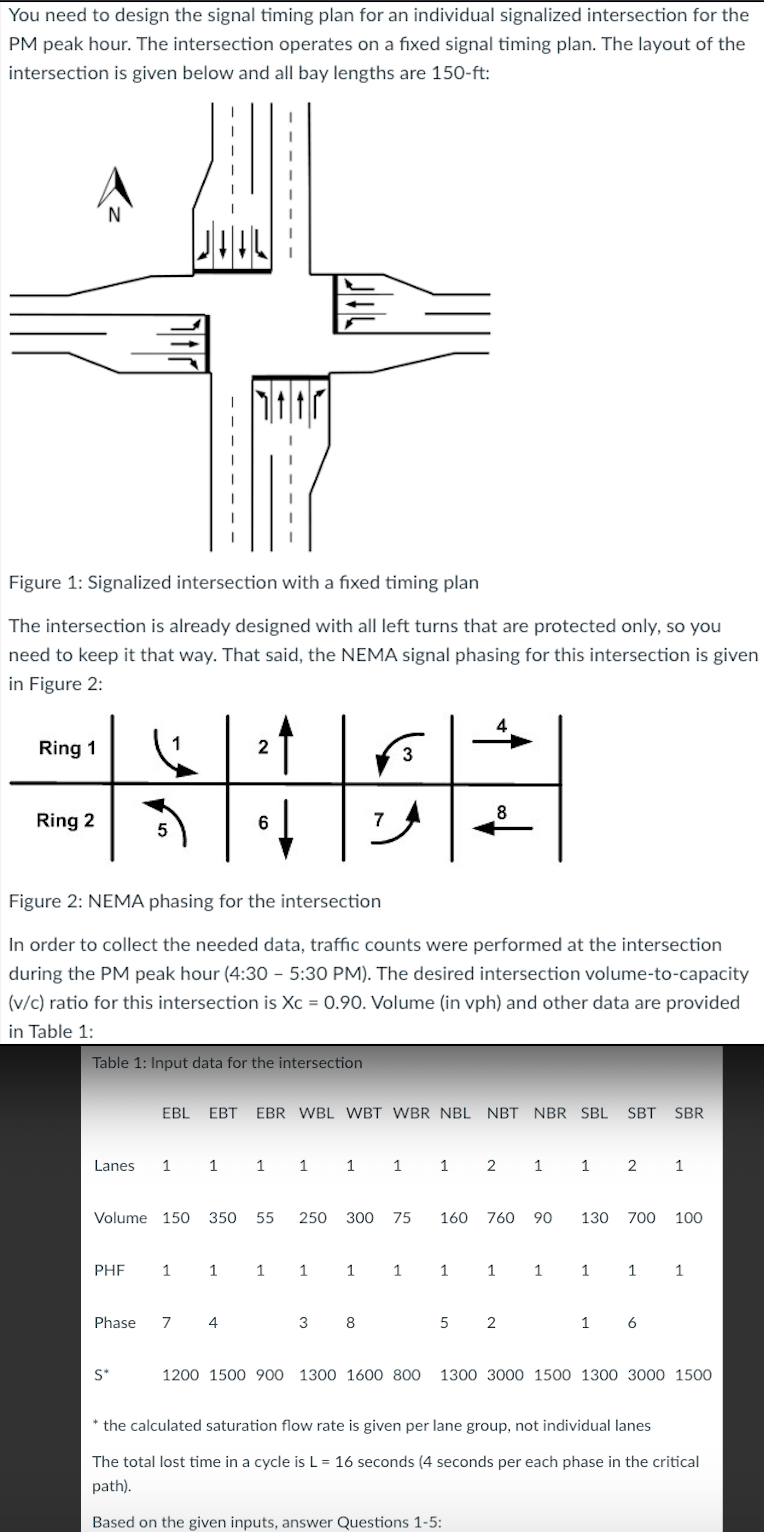
Table : Input data for the intersection
EBL EBT EBR WBL WBT WBR NBL NBT NBR SBL SBT SBR
the calculated saturation flow rate is given per lane group, not individual lanes
The total lost time in a cycle is seconds seconds per each phase in the critical
path
Based on the given inputs, answer Questions : calculated cycle length Cs
sum of flow ratio
Green time distribution for each movement phases:
Capacity for each movement vph
what is average delay for the entire intersection
Step by Step Solution
There are 3 Steps involved in it
1 Expert Approved Answer
Step: 1 Unlock

Question Has Been Solved by an Expert!
Get step-by-step solutions from verified subject matter experts
Step: 2 Unlock
Step: 3 Unlock