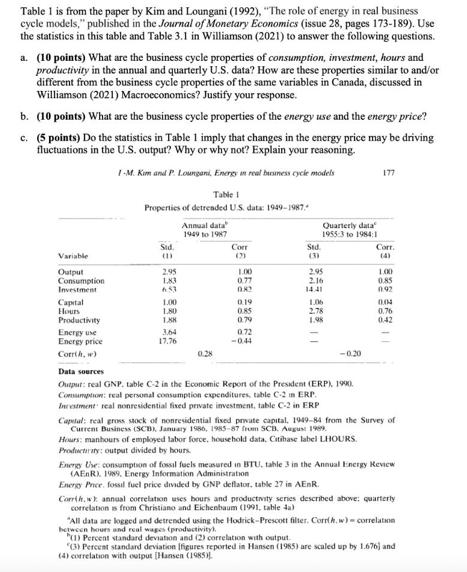
Table 1 is from the paper by Kim and Loungani (1992), The role of energy in...
Fantastic news! We've Found the answer you've been seeking!
Question:
Transcribed Image Text:
Table 1 is from the paper by Kim and Loungani (1992), "The role of energy in real business cycle models," published in the Journal of Monetary Economics (issue 28, pages 173-189). Use the statistics in this table and Table 3.1 in Williamson (2021) to answer the following questions. a. (10 points) What are the business cycle properties of consumption, investment, hours and productivity in the annual and quarterly U.S. data? How are these properties similar to and/or different from the business cycle properties of the same variables in Canada, discussed in Williamson (2021) Macroeconomics? Justify your response. b. (10 points) What are the business cycle properties of the energy use and the energy price? c. (5 points) Do the statistics in Table 1 imply that changes in the energy price may be driving fluctuations in the U.S. output? Why or why not? Explain your reasoning. 1-M. Kim and P. Loungani, Energy in real business cycle models Variable Output Consumption Investment Capital Hours Productivity Energy use Energy price Corrth, w) Table 1 Properties of detrended U.S. data: 1949-1987. Sid. (1) 2.95 1.83 6.53 1.00 1.80 1.88 3.64 17.76 Annual data 1949 to 1987 0.28 Corr (3) 1.00 0.77 0.83 0.19 0.85 0.79 0.72 -0.44 Quarterly data 1955:3 to 1984:1 Sid. (3) 2.95 216 14.41 1.06 2.78 1.98 -0.20 Data sources Output: real GNP, table C-2 in the Economic Report of the President (ERP), 1990). Consumption: real personal consumption expenditures, table C-2 in ERP. Investment real nonresidential fixed private investment, table C-2 in ERP 177 Cort. (4) 1.00 0.85 092 0.04 0.76 0.42 Capital: real gross stock of nonresidential fixed prwate capital, 1949-84 from the Survey of Current Business (SCB), January 1986, 1985-87 from SCB. August 1999, Hours: manhours of employed labor force, household data, Citihase label LHOURS. Productivity: output divided by hours. Energy Use: consumption of fossil fuels measured in BTU, tahle 3 in the Annual Energy Review (AEnR). 1989, Energy Information Administration Energy Price, fossil fuel price divided by GNP deflator, table 27 in AER. Corrih.w) annual correlation uses hours and productivity series described above: quarterly correlation is from Christiano and Eichenbaum (1991, table 4a) "All data are logged and detrended using the Hodrick-Prescott filter. Corrth.w)-correlation between hours and real wages (productivity) (1) Percent standard deviation and (2) correlation with output. (3) Percent standard deviation figures reported in Hansen (1985) are scaled up by 1.676) and (4) correlation with output [Hansen (1985) Table 1 is from the paper by Kim and Loungani (1992), "The role of energy in real business cycle models," published in the Journal of Monetary Economics (issue 28, pages 173-189). Use the statistics in this table and Table 3.1 in Williamson (2021) to answer the following questions. a. (10 points) What are the business cycle properties of consumption, investment, hours and productivity in the annual and quarterly U.S. data? How are these properties similar to and/or different from the business cycle properties of the same variables in Canada, discussed in Williamson (2021) Macroeconomics? Justify your response. b. (10 points) What are the business cycle properties of the energy use and the energy price? c. (5 points) Do the statistics in Table 1 imply that changes in the energy price may be driving fluctuations in the U.S. output? Why or why not? Explain your reasoning. 1-M. Kim and P. Loungani, Energy in real business cycle models Variable Output Consumption Investment Capital Hours Productivity Energy use Energy price Corrth, w) Table 1 Properties of detrended U.S. data: 1949-1987. Sid. (1) 2.95 1.83 6.53 1.00 1.80 1.88 3.64 17.76 Annual data 1949 to 1987 0.28 Corr (3) 1.00 0.77 0.83 0.19 0.85 0.79 0.72 -0.44 Quarterly data 1955:3 to 1984:1 Sid. (3) 2.95 216 14.41 1.06 2.78 1.98 -0.20 Data sources Output: real GNP, table C-2 in the Economic Report of the President (ERP), 1990). Consumption: real personal consumption expenditures, table C-2 in ERP. Investment real nonresidential fixed private investment, table C-2 in ERP 177 Cort. (4) 1.00 0.85 092 0.04 0.76 0.42 Capital: real gross stock of nonresidential fixed prwate capital, 1949-84 from the Survey of Current Business (SCB), January 1986, 1985-87 from SCB. August 1999, Hours: manhours of employed labor force, household data, Citihase label LHOURS. Productivity: output divided by hours. Energy Use: consumption of fossil fuels measured in BTU, tahle 3 in the Annual Energy Review (AEnR). 1989, Energy Information Administration Energy Price, fossil fuel price divided by GNP deflator, table 27 in AER. Corrih.w) annual correlation uses hours and productivity series described above: quarterly correlation is from Christiano and Eichenbaum (1991, table 4a) "All data are logged and detrended using the Hodrick-Prescott filter. Corrth.w)-correlation between hours and real wages (productivity) (1) Percent standard deviation and (2) correlation with output. (3) Percent standard deviation figures reported in Hansen (1985) are scaled up by 1.676) and (4) correlation with output [Hansen (1985)
Expert Answer:
Answer rating: 100% (QA)
Here are my answers to the questions a The business cycle properties of consumption investment hours ... View the full answer
Related Book For
Statistics The Exploration & Analysis of Data
ISBN: 978-1133164135
7th edition
Authors: Roxy Peck, Jay L. Devore
Posted Date:
Students also viewed these finance questions
-
What is the relationship between real business cycle models and DSGE models?
-
Use the diagram to answer the following questions (ad). a. At the equilibrium price before the tax is imposed, what area represents consumer surplus? What area represents producer surplus? b. Say...
-
Use the CCH IntelliConnect Citator to answer the following questions regarding Notice 2010-10: a. Where is the notice located in the Internal Revenue Bulletin? b. Where is the notice annotated? c....
-
I really would like to know the steps idk how to start this buttrying to look for the gross pays has been frustrating, pleasehelp! Each of the following workers is piece-rate workers at Golden Boats...
-
The residuals for 10 consecutive time periods are as follows: a. Plot the residuals over time. What conclusion can you reach about the pattern of the residuals over time? b. Based on (a), what...
-
This time, William Tell is shooting at an apple that hangs on a tree (Fig. 3.34). The apple is a horizontal distance of 20.0 m away and at a height of 4.00 m above the ground. If the arrow is...
-
You are doing regression with one explanatory variable and so consider the basic linear regression model \(y_{i}=\beta_{0}+\beta_{1} x_{i}+\varepsilon_{i}\). a. Show that the \(i\) th leverage can be...
-
Briefly discuss the convergence efforts that are underway in the area of intangible assets .
-
On June 3 0 , Indigo Corporation discontinued its operations in Mexico. During the year, the operating income was $ 2 1 0 , 0 0 0 before taxes. On September 1 , Indigo disposed of the Mexico facility...
-
A steel distributor cuts sheets of steel from coils supplied by major mills. Accurate forecasting of coil usage can be very beneficial in controlling raw material inventories. Eighty percent of the...
-
Write a stored procedure called array_date that takes in as input up to 31numbers in an array - and - an array of up to 12 numbers and then returns the day of the week for each day in the first array...
-
On January 1, 2015, McLean Company makes the two following acquisitions. 1. Purchases land having a fair value of 300,000 by issuing a 5-year, zero-interest-bearing promissory note in the face amount...
-
The differences between the book basis and tax basis of the assets and liabilities of Morgan Corporation at the end of 2015 are presented below. It is estimated that the litigation liability will be...
-
On January 1, 2015, Durdil Co. borrowed and received 500,000 from a major customer evidenced by a zero-interest-bearing note due in 3 years. As consideration for the zero-interest-bearing feature,...
-
Flynn Inc. has two temporary differences at the end of 2015. The first difference stems from installment sales, and the second one results from the accrual of a loss contingency. Flynns accounting...
-
Dane Co. both purchases and constructs various equipment it uses in its operations. The following items for two different types of equipment were recorded in random order during the calendar year...
-
Controlling Program Flow w/i an ATM Using selection statements & loops to complete the following: Validate the user's PIN -- only allow them to attempt three (3) times before ending the program If...
-
Identify the Critical Infrastructure Physical Protection System Plan.
-
Ozzie and Harriet Dont Live Here Anymore (San Luis Obispo Tribune, February 26, 2002) is the title of an article that looked at the changing makeup of Americas suburbs. The article states that...
-
The article Effect of Manual Defoliation on Pole Bean Yield (Journal of Economic Entomology [1984]: 10191023) used a quadratic regression model to describe the relationship between y = yield...
-
An airplane with room for 100 passengers has a total baggage limit of 6000 pounds. Suppose that the total weight of the baggage checked by an individual passenger is a random variable x with a mean...
-
Example 11.3 introduces Klein's Model I. Use the data file klein to answer the following questions. a. Estimate the consumption function in equation (11.17) by OLS. Comment on the signs and...
-
Example 11.3 introduces Klein's Model I. Use the data file klein to answer the following questions. a. Estimate the investment function in equation (11.18) by OLS. Comment on the signs and...
-
Mike's Veneer Shop owns a vacuum press that requires annual maintenance. Mike has a contract to cover the maintenance expenses for the next 5 years. The contract calls for an annual payment of \(\$...
Study smarter with the SolutionInn App