

Question: Table 1 : Labor Force Statistics by Age: Suppose people in the adult population in a small country are classified based on their age.
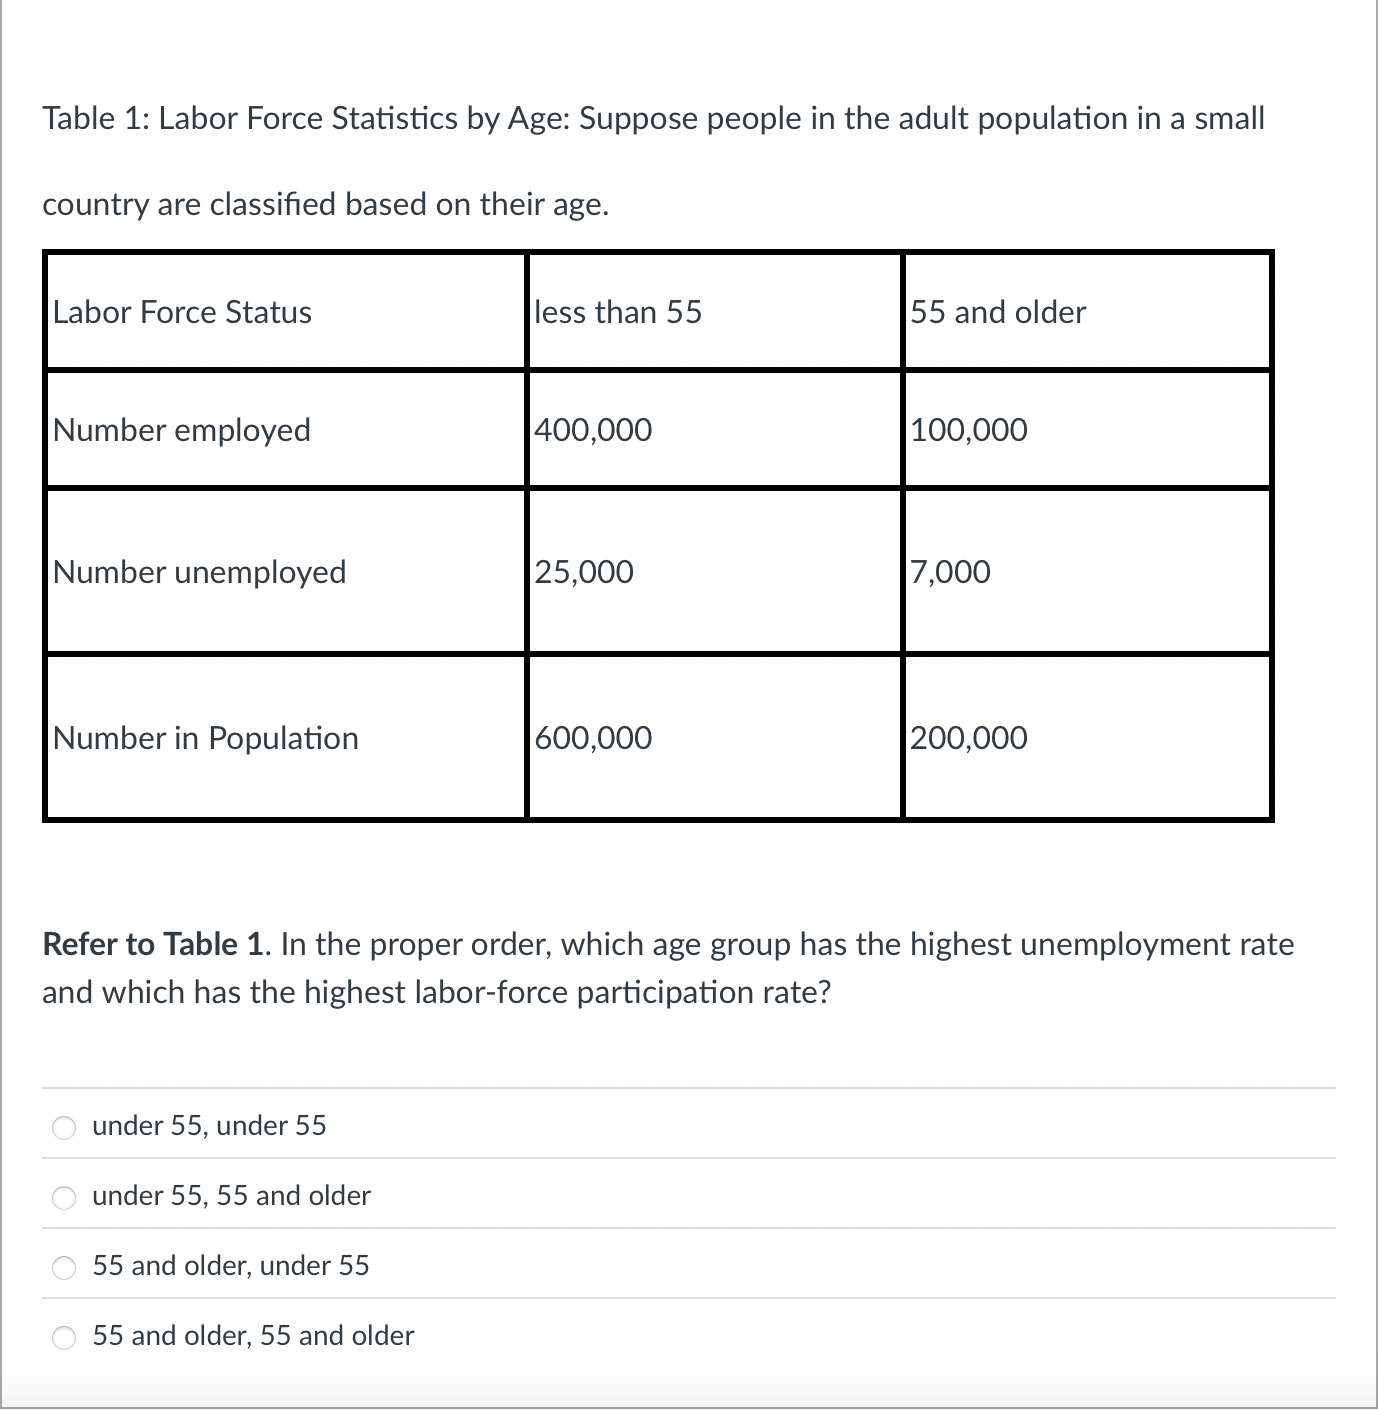
Table : Labor Force Statistics by Age: Suppose people in the adult population in a small country are classified based on their age.
begintabularlll
hline Labor Force Status & less than & and older
hline Number employed & &
hline Number unemployed & &
hline Number in Population & &
hline
endtabular
Refer to Table In the proper order, which age group has the highest unemployment rate and which has the highest laborforce participation rate?
under under
under and older
and older, under
and older, and older
Step by Step Solution
There are 3 Steps involved in it
1 Expert Approved Answer
Step: 1 Unlock

Question Has Been Solved by an Expert!
Get step-by-step solutions from verified subject matter experts
Step: 2 Unlock
Step: 3 Unlock