

Table 1 MACRS Half-Year Convention Depreciation Rate for Recovery Period 3-Year 5-Year 7-Year 10-Year 15-Year 20-Year...
Fantastic news! We've Found the answer you've been seeking!
Question:
Transcribed Image Text:
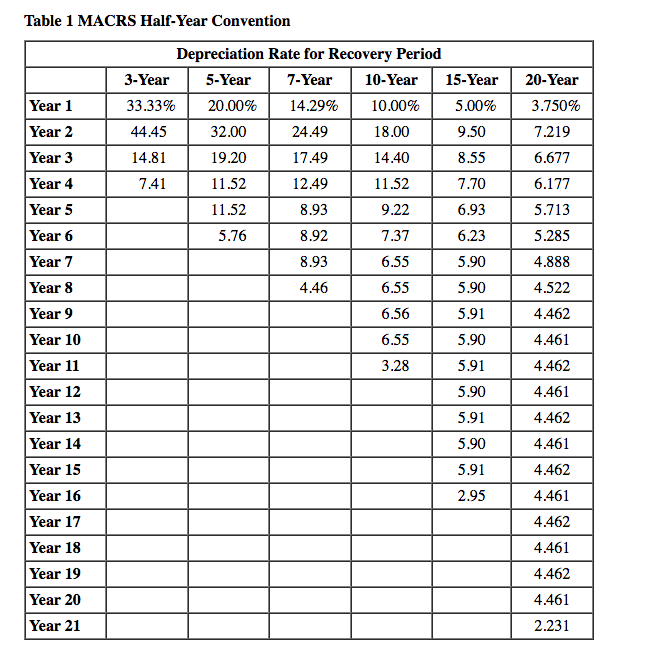
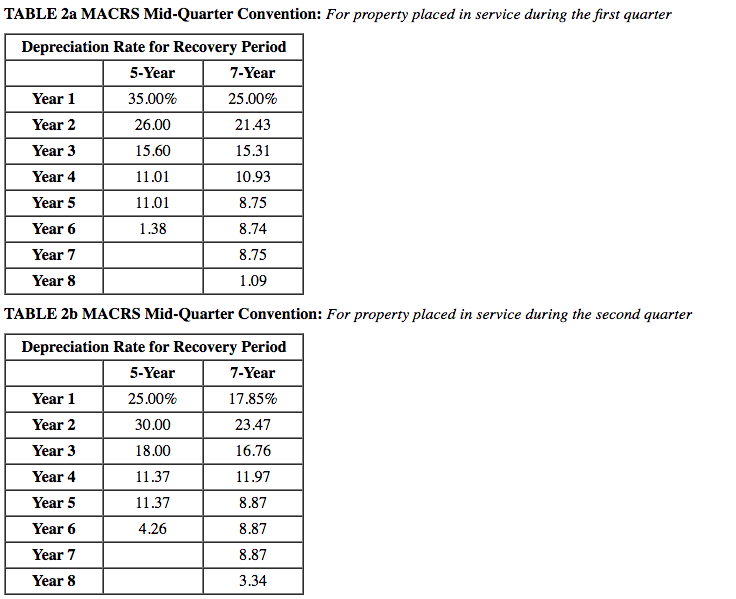
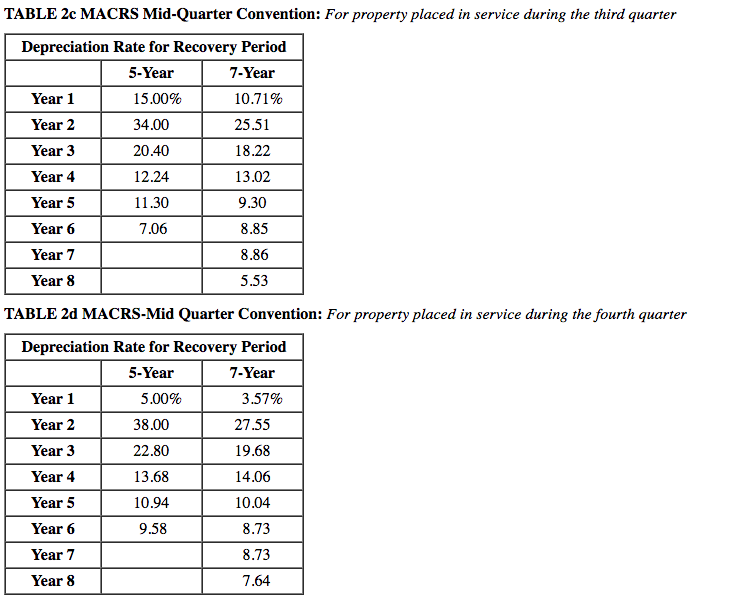
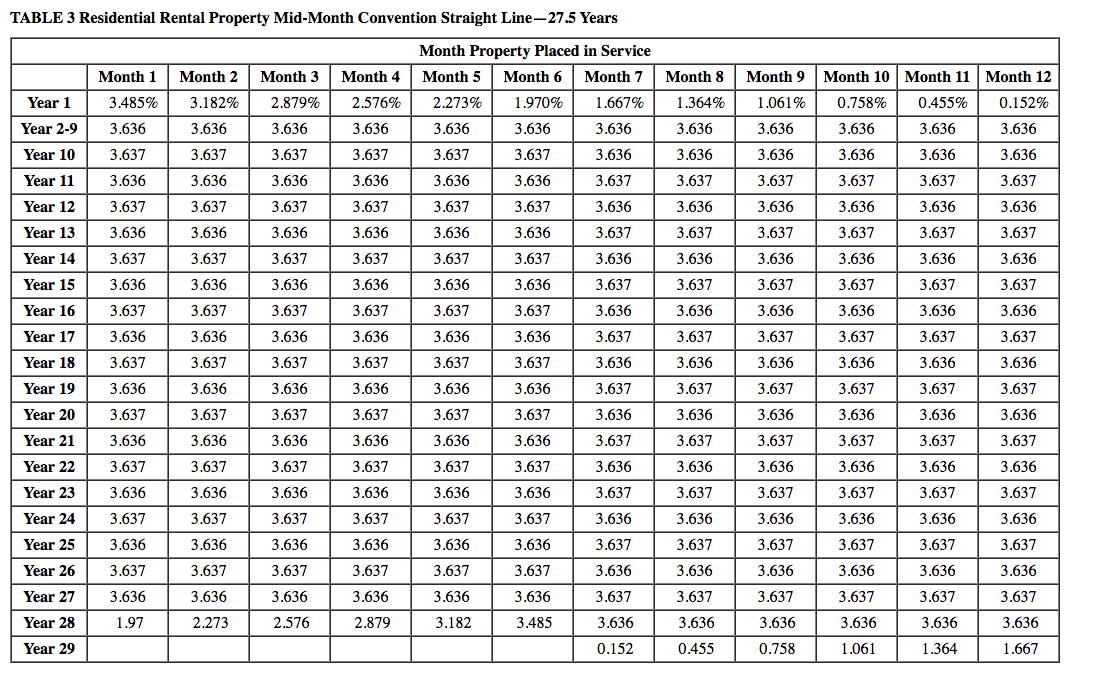
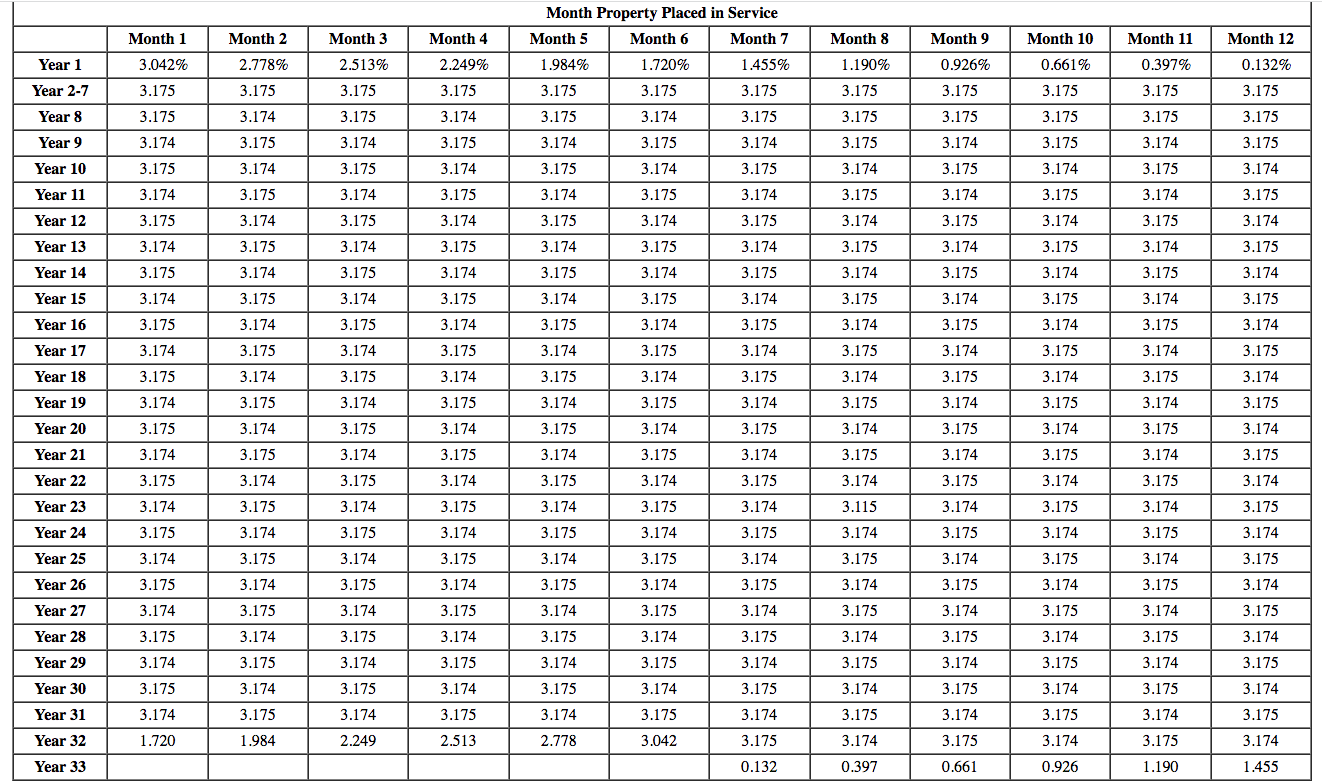
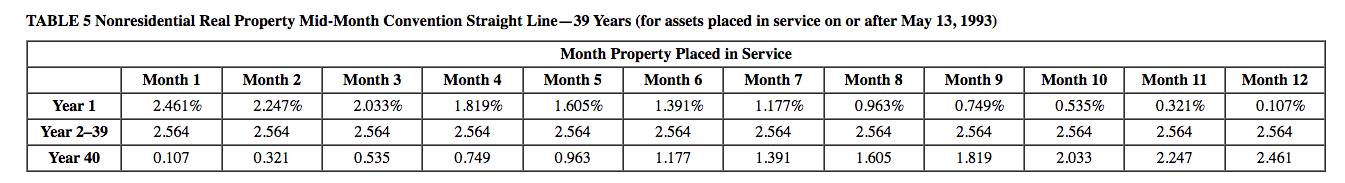
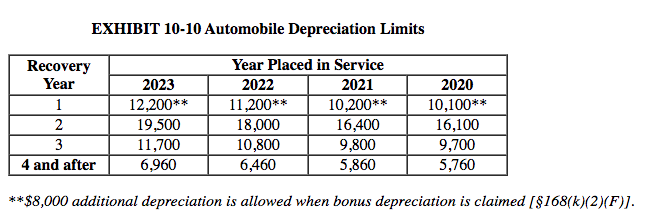
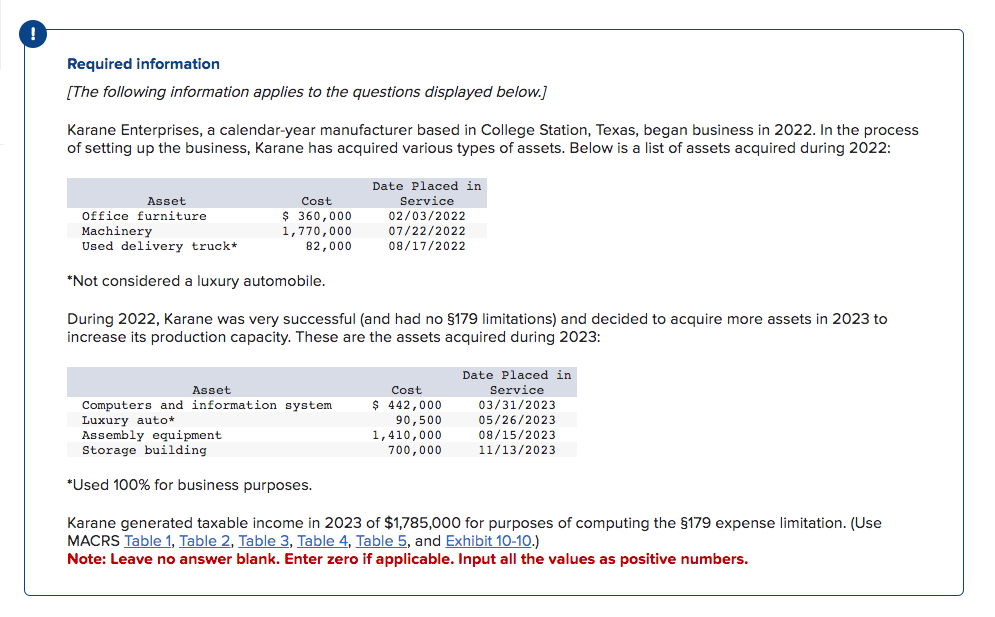
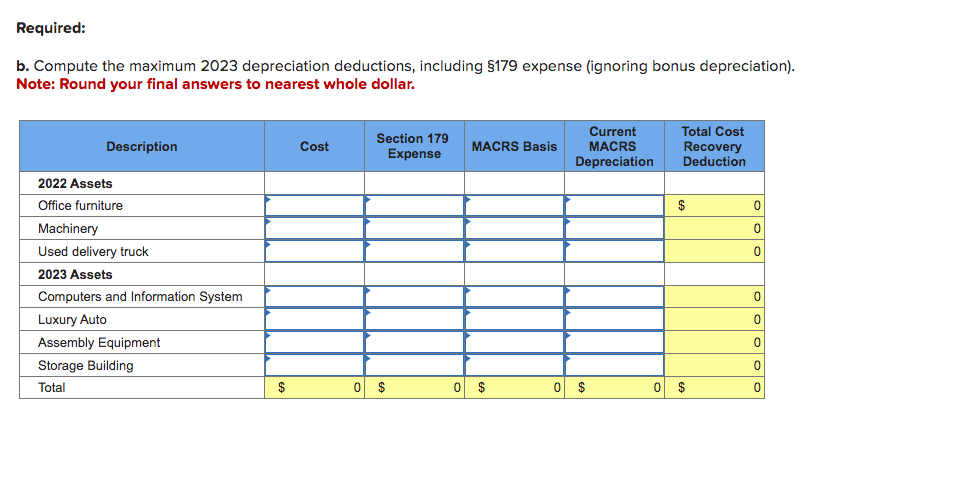
Table 1 MACRS Half-Year Convention Depreciation Rate for Recovery Period 3-Year 5-Year 7-Year 10-Year 15-Year 20-Year Year 1 33.33% 20.00% 14.29% 10.00% 5.00% 3.750% Year 2 44.45 32.00 24.49 18.00 9.50 7.219 Year 3 14.81 19.20 17.49 14.40 8.55 6.677 Year 4 7.41 11.52 12.49 11.52 7.70 6.177 Year 5 11.52 8.93 9.22 6.93 5.713 Year 6 5.76 8.92 7.37 6.23 5.285 Year 7 8.93 6.55 5.90 4.888 Year 8 4.46 6.55 5.90 4.522 Year 9 6.56 5.91 4.462 Year 10 6.55 5.90 4.461 Year 11 3.28 5.91 4.462 Year 12 5.90 4.461 Year 13 5.91 4.462 Year 14 5.90 4.461 Year 15 5.91 4.462 Year 16 2.95 4.461 Year 17 4.462 Year 18 4.461 Year 19 4.462 Year 20 Year 21 4.461 2.231 TABLE 2a MACRS Mid-Quarter Convention: For property placed in service during the first quarter Depreciation Rate for Recovery Period 5-Year 7-Year Year 1 35.00% 25.00% Year 2 26.00 21.43 Year 3 15.60 15.31 Year 4 11.01 10.93 Year 5 11.01 8.75 Year 6 1.38 8.74 Year 7 8.75 Year 8 1.09 TABLE 2b MACRS Mid-Quarter Convention: For property placed in service during the second quarter Depreciation Rate for Recovery Period 5-Year 7-Year Year 1 25.00% 17.85% Year 2 30.00 23.47 Year 3 18.00 16.76 Year 4 11.37 11.97 Year 5 11.37 8.87 Year 6 4.26 8.87 Year 7 8.87 Year 8 3.34 TABLE 2c MACRS Mid-Quarter Convention: For property placed in service during the third quarter Depreciation Rate for Recovery Period 5-Year 7-Year Year 1 15.00% 10.71% Year 2 34.00 25.51 Year 3 20.40 18.22 Year 4 12.24 13.02 Year 5 11.30 9.30 Year 6 7.06 8.85 Year 7 8.86 5.53 Year 8 TABLE 2d MACRS-Mid Quarter Convention: For property placed in service during the fourth quarter Depreciation Rate for Recovery Period 5-Year 7-Year Year 1 5.00% 3.57% Year 2 38.00 27.55 Year 3 22.80 19.68 Year 4 13.68 14.06 Year 5 10.94 10.04 Year 6 9.58 8.73 Year 7 8.73 Year 8 7.64 TABLE 3 Residential Rental Property Mid-Month Convention Straight Line-27.5 Years Month Property Placed in Service Month 1 Month 2 Month 3 Month 4 Month 5 Month 6 Month 7 Month 8 Month 9 Month 10 Month 11 Month 12 Year 1 3.485% 3.182% 2.879% 2.576% 2.273% 1.970% 1.667% 1.364% 1.061% 0.758% 0.455% 0.152% Year 2-9 3.636 3.636 3.636 3.636 3.636 3.636 3.636 3.636 3.636 3.636 3.636 3.636 Year 10 3.637 3.637 3.637 3.637 3.637 3.637 3.636 3.636 3.636 3.636 3.636 3.636 Year 11 3.636 3.636 3.636 3.636 3.636 3.636 3.637 3.637 3.637 3.637 3.637 3.637 Year 12 3.637 3.637 3.637 3.637 3.637 3.637 3.636 3.636 3.636 3.636 3.636 3.636 Year 13 3.636 3.636 3.636 3.636 3.636 3.636 3.637 3.637 3.637 3.637 3.637 3.637 Year 14 3.637 3.637 3.637 3.637 3.637 3.637 3.636 3.636 3.636 3.636 3.636 3.636 Year 15 3.636 3.636 3.636 3.636 3.636 3.636 3.637 3.637 3.637 3.637 3.637 3.637 Year 16 3.637 3.637 3.637 3.637 3.637 3.637 3.636 3.636 3.636 3.636 3.636 3.636 Year 17 3.636 3.636 3.636 3.636 3.636 3.636 3.637 3.637 3.637 3.637 3.637 3.637 Year 18 3.637 3.637 3.637 3.637 3.637 3.637 3.636 3.636 3.636 3.636 3.636 3.636 Year 19 3.636 3.636 3.636 3.636 3.636 3.636 3.637 3.637 3.637 3.637 3.637 3.637 Year 20 3.637 3.637 3.637 3.637 3.637 3.637 3.636 3.636 3.636 3.636 3.636 3.636 Year 21 3.636 3.636 3.636 3.636 3.636 3.636 3.637 3.637 3.637 3.637 3.637 3.637 Year 22 3.637 3.637 3.637 3.637 3.637 3.637 3.636 3.636 3.636 3.636 3.636 3.636 Year 23 3.636 3.636 3.636 3.636 3.636 3.636 3.637 3.637 3.637 3.637 3.637 3.637 Year 24 3.637 3.637 3.637 3.637 3.637 3.637 3.636 3.636 3.636 3.636 3.636 3.636 Year 25 3.636 3.636 3.636 3.636 3.636 3.636 3.637 3.637 3.637 3.637 3.637 3.637 Year 26 3.637 3.637 3.637 3.637 3.637 3.637 3.636 3.636 3.636 3.636 3.636 3.636 Year 27 3.636 3.636 3.636 3.636 3.636 3.636 3.637 3.637 3.637 3.637 3.637 3.637 Year 28 1.97 2.273 2.576 2.879 3.182 3.485 3.636 3.636 3.636 3.636 3.636 3.636 Year 29 0.152 0.455 0.758 1.061 1.364 1.667 Month Property Placed in Service Month 1 Month 2 Month 3 Month 4 Month 5 Month 6 Month 7 Month 8 Month 9 Month 10 Month 11 Month 12 Year 1 3.042% 2.778% 2.513% 2.249% 1.984% 1.720% 1.455% 1.190% 0.926% 0.661% 0.397% 0.132% Year 2-7 3.175 3.175 3.175 3.175 3.175 3.175 3.175 3.175 3.175 3.175 3.175 3.175 Year 8 3.175 3.174 3.175 3.174 3.175 3.174 3.175 3.175 3.175 3.175 3.175 3.175 Year 9 3.174 3.175 3.174 3.175 3.174 3.175 3.174 3.175 3.174 3.175 3.174 3.175 Year 10 3.175 3.174 3.175 3.174 3.175 3.174 3.175 3.174 3.175 3.174 3.175 3.174 Year 11 3.174 3.175 3.174 3.175 3.174 3.175 3.174 3.175 3.174 3.175 3.174 3.175 Year 12 3.175 3.174 3.175 3.174 3.175 3.174 3.175 3.174 3.175 3.174 3.175 3.174 Year 13 3.174 3.175 3.174 3.175 3.174 3.175 3.174 3.175 3.174 3.175 3.174 3.175 Year 14 3.175 3.174 3.175 3.174 3.175 3.174 3.175 3.174 3.175 3.174 3.175 3.174 Year 15 3.174 3.175 3.174 3.175 3.174 3.175 3.174 3.175 3.174 3.175 3.174 3.175 Year 16 3.175 3.174 3.175 3.174 3.175 3.174 3.175 3.174 3.175 3.174 3.175 3.174 Year 17 3.174 3.175 3.174 3.175 3.174 3.175 3.174 3.175 3.174 3.175 3.174 3.175 Year 18 3.175 3.174 3.175 3.174 3.175 3.174 3.175 3.174 3.175 3.174 3.175 3.174 Year 19 3.174 3.175 3.174 3.175 3.174 3.175 3.174 3.175 3.174 3.175 3.174 3.175 Year 20 3.175 3.174 3.175 3.174 3.175 3.174 3.175 3.174 3.175 3.174 3.175 3.174 Year 21 3.174 3.175 3.174 3.175 3.174 3.175 3.174 3.175 3.174 3.175 3.174 3.175 Year 22 3.175 3.174 3.175 3.174 3.175 3.174 3.175 3.174 3.175 3.174 3.175 3.174 Year 23 3.174 3.175 3.174 3.175 3.174 3.175 3.174 3.115 3.174 3.175 3.174 3.175 Year 24 3.175 3.174 3.175 3.174 3.175 3.174 3.175 3.174 3.175 3.174 3.175 3.174 Year 25 3.174 3.175 3.174 3.175 3.174 3.175 3.174 3.175 3.174 3.175 3.174 3.175 Year 26 3.175 3.174 3.175 3.174 3.175 3.174 3.175 3.174 3.175 3.174 3.175 3.174 Year 27 3.174 3.175 3.174 3.175 3.174 3.175 3.174 3.175 3.174 3.175 3.174 3.175 Year 28 3.175 3.174 3.175 3.174 3.175 3.174 3.175 3.174 3.175 3.174 3.175 3.174 Year 29 3.174 3.175 3.174 3.175 3.174 3.175 3.174 3.175 3.174 3.175 3.174 3.175 Year 30 3.175 3.174 3.175 3.174 3.175 3.174 3.175 3.174 3.175 3.174 3.175 3.174 Year 31 3.174 3.175 3.174 3.175 3.174 3.175 3.174 3.175 3.174 3.175 3.174 3.175 Year 32 1.720 1.984 2.249 2.513 2.778 3.042 3.175 3.174 3.175 3.174 3.175 3.174 Year 33 0.132 0.397 0.661 0.926 1.190 1.455 TABLE 5 Nonresidential Real Property Mid-Month Convention Straight Line-39 Years (for assets placed in service on or after May 13, 1993) Month Property Placed in Service Month 1 Month 2 Month 3 Month 4 Month 5 Month 6 Month 7 Month 8 Month 9 Month 10 Month 11 Month 12 Year 1 2.461% 2.247% 2.033% 1.819% 1.605% 1.391% 1.177% 0.963% 0.749% 0.535% 0.321% Year 2-39 2.564 2.564 2.564 2.564 2.564 2.564 2.564 2.564 2.564 2.564 2.564 0.107% 2.564 Year 40 0.107 0.321 0.535 0.749 0.963 1.177 1.391 1.605 1.819 2.033 2.247 2.461 EXHIBIT 10-10 Automobile Depreciation Limits Year Placed in Service Recovery Year 2023 2022 2021 2020 1 12,200** 11,200** 10,200** 10,100** 2 19,500 18,000 16,400 16,100 3 11,700 10,800 9,800 9,700 4 and after 6,960 6,460 5,860 5,760 **$8,000 additional depreciation is allowed when bonus depreciation is claimed [168(k)(2)(F)]. ! Required information [The following information applies to the questions displayed below.] Karane Enterprises, a calendar-year manufacturer based in College Station, Texas, began business in 2022. In the process of setting up the business, Karane has acquired various types of assets. Below is a list of assets acquired during 2022: Date Placed in Asset Office furniture Machinery Used delivery truck* Cost Service $ 360,000 1,770,000 82,000 02/03/2022 07/22/2022 08/17/2022 *Not considered a luxury automobile. During 2022, Karane was very successful (and had no 179 limitations) and decided to acquire more assets in 2023 to increase its production capacity. These are the assets acquired during 2023: Date Placed in Asset Cost Service Computers and information system $ 442,000 03/31/2023 Luxury auto* Assembly equipment Storage building 90,500 1,410,000 700,000 05/26/2023 08/15/2023 11/13/2023 *Used 100% for business purposes. Karane generated taxable income in 2023 of $1,785,000 for purposes of computing the $179 expense limitation. (Use MACRS Table 1, Table 2, Table 3, Table 4, Table 5, and Exhibit 10-10.) Note: Leave no answer blank. Enter zero if applicable. Input all the values as positive numbers. Required: b. Compute the maximum 2023 depreciation deductions, including 179 expense (ignoring bonus depreciation). Note: Round your final answers to nearest whole dollar. Description 2022 Assets Office furniture Machinery Used delivery truck 2023 Assets Computers and Information System Luxury Auto Assembly Equipment Storage Building Total Cost Section 179 Expense MACRS Basis Current MACRS Depreciation Total Cost Recovery Deduction $ 0 0 0 0 0 0 0 0 $ 0 0 $ 0 0 Table 1 MACRS Half-Year Convention Depreciation Rate for Recovery Period 3-Year 5-Year 7-Year 10-Year 15-Year 20-Year Year 1 33.33% 20.00% 14.29% 10.00% 5.00% 3.750% Year 2 44.45 32.00 24.49 18.00 9.50 7.219 Year 3 14.81 19.20 17.49 14.40 8.55 6.677 Year 4 7.41 11.52 12.49 11.52 7.70 6.177 Year 5 11.52 8.93 9.22 6.93 5.713 Year 6 5.76 8.92 7.37 6.23 5.285 Year 7 8.93 6.55 5.90 4.888 Year 8 4.46 6.55 5.90 4.522 Year 9 6.56 5.91 4.462 Year 10 6.55 5.90 4.461 Year 11 3.28 5.91 4.462 Year 12 5.90 4.461 Year 13 5.91 4.462 Year 14 5.90 4.461 Year 15 5.91 4.462 Year 16 2.95 4.461 Year 17 4.462 Year 18 4.461 Year 19 4.462 Year 20 Year 21 4.461 2.231 TABLE 2a MACRS Mid-Quarter Convention: For property placed in service during the first quarter Depreciation Rate for Recovery Period 5-Year 7-Year Year 1 35.00% 25.00% Year 2 26.00 21.43 Year 3 15.60 15.31 Year 4 11.01 10.93 Year 5 11.01 8.75 Year 6 1.38 8.74 Year 7 8.75 Year 8 1.09 TABLE 2b MACRS Mid-Quarter Convention: For property placed in service during the second quarter Depreciation Rate for Recovery Period 5-Year 7-Year Year 1 25.00% 17.85% Year 2 30.00 23.47 Year 3 18.00 16.76 Year 4 11.37 11.97 Year 5 11.37 8.87 Year 6 4.26 8.87 Year 7 8.87 Year 8 3.34 TABLE 2c MACRS Mid-Quarter Convention: For property placed in service during the third quarter Depreciation Rate for Recovery Period 5-Year 7-Year Year 1 15.00% 10.71% Year 2 34.00 25.51 Year 3 20.40 18.22 Year 4 12.24 13.02 Year 5 11.30 9.30 Year 6 7.06 8.85 Year 7 8.86 5.53 Year 8 TABLE 2d MACRS-Mid Quarter Convention: For property placed in service during the fourth quarter Depreciation Rate for Recovery Period 5-Year 7-Year Year 1 5.00% 3.57% Year 2 38.00 27.55 Year 3 22.80 19.68 Year 4 13.68 14.06 Year 5 10.94 10.04 Year 6 9.58 8.73 Year 7 8.73 Year 8 7.64 TABLE 3 Residential Rental Property Mid-Month Convention Straight Line-27.5 Years Month Property Placed in Service Month 1 Month 2 Month 3 Month 4 Month 5 Month 6 Month 7 Month 8 Month 9 Month 10 Month 11 Month 12 Year 1 3.485% 3.182% 2.879% 2.576% 2.273% 1.970% 1.667% 1.364% 1.061% 0.758% 0.455% 0.152% Year 2-9 3.636 3.636 3.636 3.636 3.636 3.636 3.636 3.636 3.636 3.636 3.636 3.636 Year 10 3.637 3.637 3.637 3.637 3.637 3.637 3.636 3.636 3.636 3.636 3.636 3.636 Year 11 3.636 3.636 3.636 3.636 3.636 3.636 3.637 3.637 3.637 3.637 3.637 3.637 Year 12 3.637 3.637 3.637 3.637 3.637 3.637 3.636 3.636 3.636 3.636 3.636 3.636 Year 13 3.636 3.636 3.636 3.636 3.636 3.636 3.637 3.637 3.637 3.637 3.637 3.637 Year 14 3.637 3.637 3.637 3.637 3.637 3.637 3.636 3.636 3.636 3.636 3.636 3.636 Year 15 3.636 3.636 3.636 3.636 3.636 3.636 3.637 3.637 3.637 3.637 3.637 3.637 Year 16 3.637 3.637 3.637 3.637 3.637 3.637 3.636 3.636 3.636 3.636 3.636 3.636 Year 17 3.636 3.636 3.636 3.636 3.636 3.636 3.637 3.637 3.637 3.637 3.637 3.637 Year 18 3.637 3.637 3.637 3.637 3.637 3.637 3.636 3.636 3.636 3.636 3.636 3.636 Year 19 3.636 3.636 3.636 3.636 3.636 3.636 3.637 3.637 3.637 3.637 3.637 3.637 Year 20 3.637 3.637 3.637 3.637 3.637 3.637 3.636 3.636 3.636 3.636 3.636 3.636 Year 21 3.636 3.636 3.636 3.636 3.636 3.636 3.637 3.637 3.637 3.637 3.637 3.637 Year 22 3.637 3.637 3.637 3.637 3.637 3.637 3.636 3.636 3.636 3.636 3.636 3.636 Year 23 3.636 3.636 3.636 3.636 3.636 3.636 3.637 3.637 3.637 3.637 3.637 3.637 Year 24 3.637 3.637 3.637 3.637 3.637 3.637 3.636 3.636 3.636 3.636 3.636 3.636 Year 25 3.636 3.636 3.636 3.636 3.636 3.636 3.637 3.637 3.637 3.637 3.637 3.637 Year 26 3.637 3.637 3.637 3.637 3.637 3.637 3.636 3.636 3.636 3.636 3.636 3.636 Year 27 3.636 3.636 3.636 3.636 3.636 3.636 3.637 3.637 3.637 3.637 3.637 3.637 Year 28 1.97 2.273 2.576 2.879 3.182 3.485 3.636 3.636 3.636 3.636 3.636 3.636 Year 29 0.152 0.455 0.758 1.061 1.364 1.667 Month Property Placed in Service Month 1 Month 2 Month 3 Month 4 Month 5 Month 6 Month 7 Month 8 Month 9 Month 10 Month 11 Month 12 Year 1 3.042% 2.778% 2.513% 2.249% 1.984% 1.720% 1.455% 1.190% 0.926% 0.661% 0.397% 0.132% Year 2-7 3.175 3.175 3.175 3.175 3.175 3.175 3.175 3.175 3.175 3.175 3.175 3.175 Year 8 3.175 3.174 3.175 3.174 3.175 3.174 3.175 3.175 3.175 3.175 3.175 3.175 Year 9 3.174 3.175 3.174 3.175 3.174 3.175 3.174 3.175 3.174 3.175 3.174 3.175 Year 10 3.175 3.174 3.175 3.174 3.175 3.174 3.175 3.174 3.175 3.174 3.175 3.174 Year 11 3.174 3.175 3.174 3.175 3.174 3.175 3.174 3.175 3.174 3.175 3.174 3.175 Year 12 3.175 3.174 3.175 3.174 3.175 3.174 3.175 3.174 3.175 3.174 3.175 3.174 Year 13 3.174 3.175 3.174 3.175 3.174 3.175 3.174 3.175 3.174 3.175 3.174 3.175 Year 14 3.175 3.174 3.175 3.174 3.175 3.174 3.175 3.174 3.175 3.174 3.175 3.174 Year 15 3.174 3.175 3.174 3.175 3.174 3.175 3.174 3.175 3.174 3.175 3.174 3.175 Year 16 3.175 3.174 3.175 3.174 3.175 3.174 3.175 3.174 3.175 3.174 3.175 3.174 Year 17 3.174 3.175 3.174 3.175 3.174 3.175 3.174 3.175 3.174 3.175 3.174 3.175 Year 18 3.175 3.174 3.175 3.174 3.175 3.174 3.175 3.174 3.175 3.174 3.175 3.174 Year 19 3.174 3.175 3.174 3.175 3.174 3.175 3.174 3.175 3.174 3.175 3.174 3.175 Year 20 3.175 3.174 3.175 3.174 3.175 3.174 3.175 3.174 3.175 3.174 3.175 3.174 Year 21 3.174 3.175 3.174 3.175 3.174 3.175 3.174 3.175 3.174 3.175 3.174 3.175 Year 22 3.175 3.174 3.175 3.174 3.175 3.174 3.175 3.174 3.175 3.174 3.175 3.174 Year 23 3.174 3.175 3.174 3.175 3.174 3.175 3.174 3.115 3.174 3.175 3.174 3.175 Year 24 3.175 3.174 3.175 3.174 3.175 3.174 3.175 3.174 3.175 3.174 3.175 3.174 Year 25 3.174 3.175 3.174 3.175 3.174 3.175 3.174 3.175 3.174 3.175 3.174 3.175 Year 26 3.175 3.174 3.175 3.174 3.175 3.174 3.175 3.174 3.175 3.174 3.175 3.174 Year 27 3.174 3.175 3.174 3.175 3.174 3.175 3.174 3.175 3.174 3.175 3.174 3.175 Year 28 3.175 3.174 3.175 3.174 3.175 3.174 3.175 3.174 3.175 3.174 3.175 3.174 Year 29 3.174 3.175 3.174 3.175 3.174 3.175 3.174 3.175 3.174 3.175 3.174 3.175 Year 30 3.175 3.174 3.175 3.174 3.175 3.174 3.175 3.174 3.175 3.174 3.175 3.174 Year 31 3.174 3.175 3.174 3.175 3.174 3.175 3.174 3.175 3.174 3.175 3.174 3.175 Year 32 1.720 1.984 2.249 2.513 2.778 3.042 3.175 3.174 3.175 3.174 3.175 3.174 Year 33 0.132 0.397 0.661 0.926 1.190 1.455 TABLE 5 Nonresidential Real Property Mid-Month Convention Straight Line-39 Years (for assets placed in service on or after May 13, 1993) Month Property Placed in Service Month 1 Month 2 Month 3 Month 4 Month 5 Month 6 Month 7 Month 8 Month 9 Month 10 Month 11 Month 12 Year 1 2.461% 2.247% 2.033% 1.819% 1.605% 1.391% 1.177% 0.963% 0.749% 0.535% 0.321% Year 2-39 2.564 2.564 2.564 2.564 2.564 2.564 2.564 2.564 2.564 2.564 2.564 0.107% 2.564 Year 40 0.107 0.321 0.535 0.749 0.963 1.177 1.391 1.605 1.819 2.033 2.247 2.461 EXHIBIT 10-10 Automobile Depreciation Limits Year Placed in Service Recovery Year 2023 2022 2021 2020 1 12,200** 11,200** 10,200** 10,100** 2 19,500 18,000 16,400 16,100 3 11,700 10,800 9,800 9,700 4 and after 6,960 6,460 5,860 5,760 **$8,000 additional depreciation is allowed when bonus depreciation is claimed [168(k)(2)(F)]. ! Required information [The following information applies to the questions displayed below.] Karane Enterprises, a calendar-year manufacturer based in College Station, Texas, began business in 2022. In the process of setting up the business, Karane has acquired various types of assets. Below is a list of assets acquired during 2022: Date Placed in Asset Office furniture Machinery Used delivery truck* Cost Service $ 360,000 1,770,000 82,000 02/03/2022 07/22/2022 08/17/2022 *Not considered a luxury automobile. During 2022, Karane was very successful (and had no 179 limitations) and decided to acquire more assets in 2023 to increase its production capacity. These are the assets acquired during 2023: Date Placed in Asset Cost Service Computers and information system $ 442,000 03/31/2023 Luxury auto* Assembly equipment Storage building 90,500 1,410,000 700,000 05/26/2023 08/15/2023 11/13/2023 *Used 100% for business purposes. Karane generated taxable income in 2023 of $1,785,000 for purposes of computing the $179 expense limitation. (Use MACRS Table 1, Table 2, Table 3, Table 4, Table 5, and Exhibit 10-10.) Note: Leave no answer blank. Enter zero if applicable. Input all the values as positive numbers. Required: b. Compute the maximum 2023 depreciation deductions, including 179 expense (ignoring bonus depreciation). Note: Round your final answers to nearest whole dollar. Description 2022 Assets Office furniture Machinery Used delivery truck 2023 Assets Computers and Information System Luxury Auto Assembly Equipment Storage Building Total Cost Section 179 Expense MACRS Basis Current MACRS Depreciation Total Cost Recovery Deduction $ 0 0 0 0 0 0 0 0 $ 0 0 $ 0 0
Expert Answer:

Related Book For 
Federal Taxation 2020 Comprehensive
ISBN: 9780135196274
33rd Edition
Authors: Timothy J. Rupert, Kenneth E. Anderson, David S. Hulse
Posted Date:
Students also viewed these accounting questions
-
The following Venn diagram describes cars sold last summer at Pennys Autoland. The letter F represents four-wheel drive, S represents satellite radio, and R represents remote start. a. How many...
-
My question is how to write the code in WareHouse.java This is WareHouse.java package warehouse; /* * * This class implements a warehouse on a Hash Table like structure, * where each entry of the...
-
This assignment requires you to complete the 2022 tax reporting for a fictional woman named Anna Smith. Question 1 T1 - step 4 - line 66 This is Anna's taxable income Answer: Question 2 T1 - step...
-
At December 31, 2016, Pioneer Corporation reported the stockholders' equity accounts shown here (with dollar amounts in millions, except per-share amounts). Common stock $3.00 par value per share, 22...
-
Write a method that parses a binary number as a string into a decimal integer. The method header is as follows: public static int binary to Decimal(String binaryString) For example, binary string...
-
Refer to Exercise 73. Here is a better graph of the 2008 salary distributions for the Yankees and the Phillies. Write a few sentences comparing these two distributions. Exercise 73. Does paying high...
-
On June 28, 1997, in Las Vegas, heavyweight boxers Mike Tyson and Evander Holyfield met for what proved to be a night to remember. During the third round of the fight, a desperate Tyson illegally bit...
-
On July 1, 2015, Friedman Inc. invested $720,000 in a mine estimated to have 900,000 tons of ore of uniform grade. During the last 6 months of 2015, 100,000 tons of ore were mined and sold....
-
Medicare is financed through which three primary sources? Public donations, beneficiary premiums, general tax revenue General tax revenue, beneficiary premiums, payroll tax contributions Payroll tax...
-
Empowerment and teamwork of frontline service workers are cited as a key to success in service businesses but when is empowerment most effective? What are the proper boundaries for empowerment, the...
-
Little Pear is subject to a company tax rate of 30%. The company asks you to assess and calculate the after-tax (where relevant) cost of each of the following sources of funds: a. Ordinary $1 shares...
-
Question1: Write a program in python to Get Current Date and Time. Question 2: Write a program in python to Add Two Matrices.
-
How can accounting transactions or errors affect the notes to the financial statements, and what specific disclosures or information may need to be included in these notes to provide a full and...
-
Arias has an average age of inventory of 90 days, an average payment period of 30 days and an average collection period of 40 days.What is the firm's operating cycle in terms of days? Babbit, Inc....
-
Project A has a beta of 1 . 5 and an expected rate of rate of return of 1 7 . 2 % . Project B has a beta of 0 . 8 and an expected rate of return of 1 1 . 5 % . What is the risk - free rate?
-
You are working in the finance department of MicroNet Technologies Ltd (MNT). TheCompany has spent $2.7 million in research and development over the past 18 monthsdeveloping technology which will be...
-
Define the essential properties of the following types of operating systems: a. Batch b. Interactive c. Time sharing d. Real time e. Network f. Parallel g. Distributed h. Clustered i. Handheld
-
What taxpayers are eligible to deduct qualified moving expenses in years 2018-2025?
-
Alice is a single mother, 37 years old, and has two qualifying children, ages 3 and 6. In 2019, she earns $20,000 m wages resulting in $20,000 of AGI. Is Alice eligible for the earned income credit?
-
Mr. and Mrs. Kitchens purchased their first home in Ohio for $135,000 on October 1, 2018. Because Mr. Kitchens' employer transferred him to Utah, they sold the house for $160,000 on January 10, 2019....
-
When marginal cost equals the minimum point of average variable cost, what is true about the average productivity and marginal productivity of workers?
-
What determines the distance between the average total cost and the average variable cost?
-
If average productivity falls, will marginal cost necessarily rise? How about average cost?

Study smarter with the SolutionInn App