

Question: Table 1 MACRS Half-Year Convention Year 1 Year 2 Year 3 Depreciation Rate for Recovery Period 3-Year 5-Year 7-Year 10-Year 15-Year 33.33% 20.00% 14.29% 10.00%
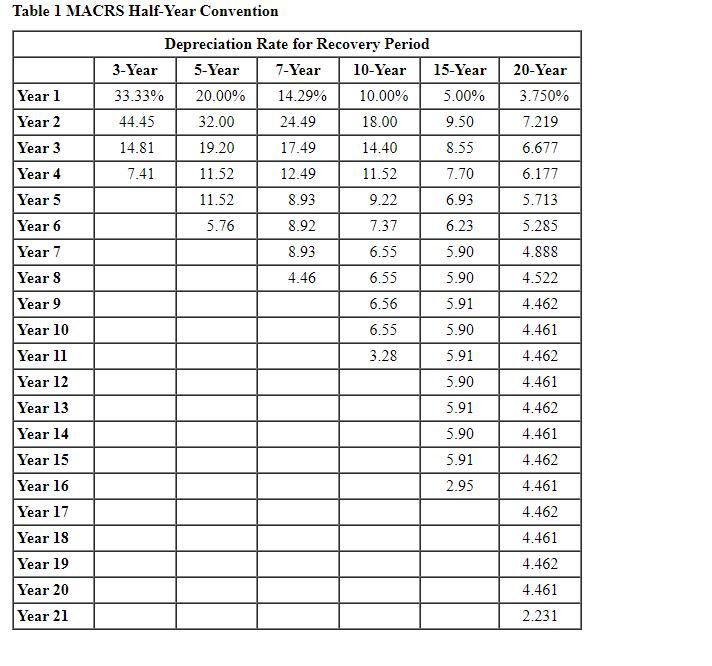
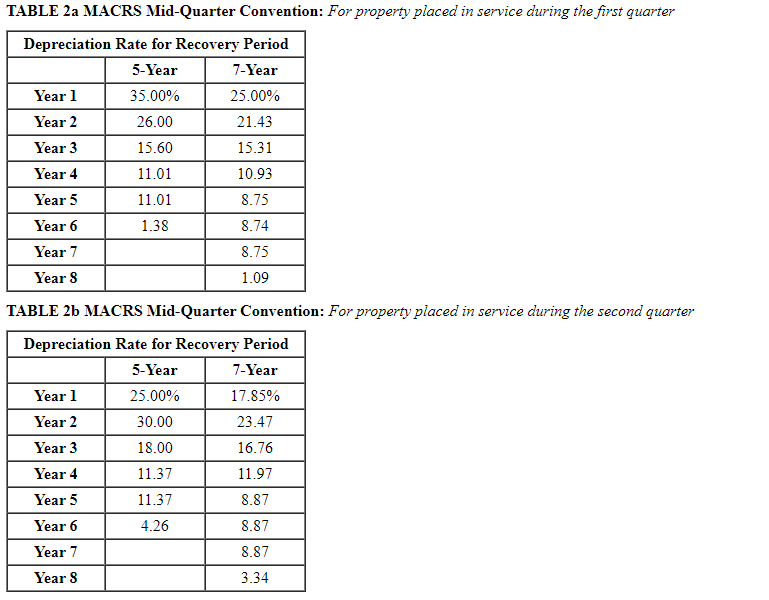
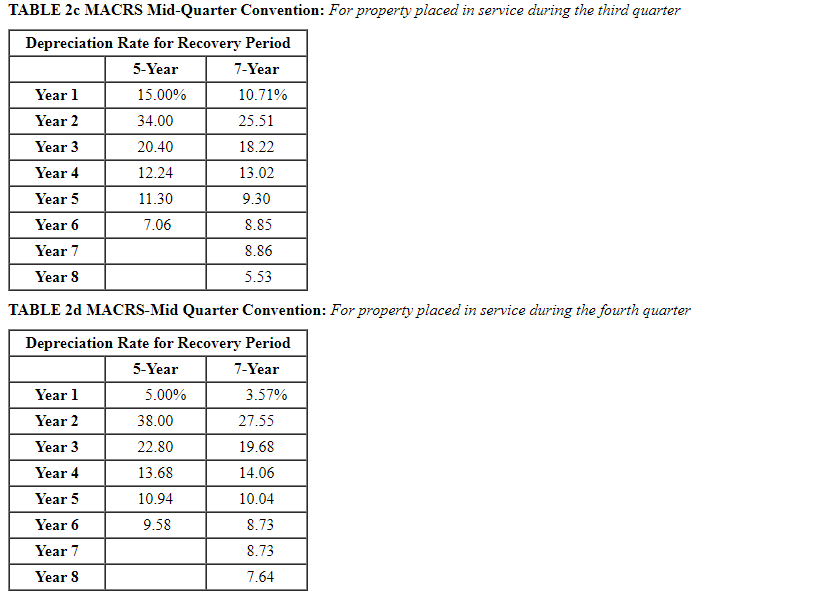
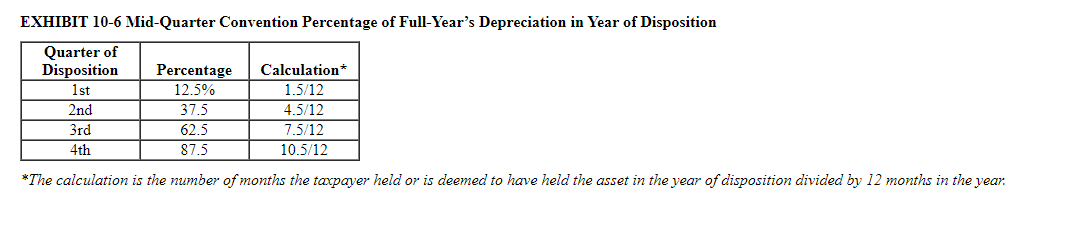
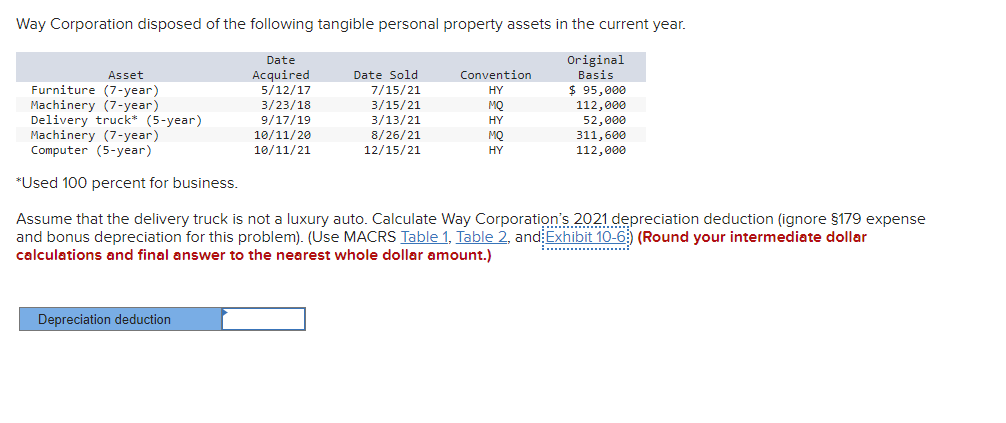
Table 1 MACRS Half-Year Convention Year 1 Year 2 Year 3 Depreciation Rate for Recovery Period 3-Year 5-Year 7-Year 10-Year 15-Year 33.33% 20.00% 14.29% 10.00% 5.00% 44.45 32.00 24.49 18.00 9.50 14.81 19.20 17.49 14.40 8.55 7.41 11.52 12.49 11.52 7.70 11.52 8.93 9.22 6.93 Year 4 Year 5 Year 6 5.76 8.92 6.23 8.93 7.37 6.55 6.55 Year 7 Year 8 5.90 4.46 5.90 6.56 5.91 Year 9 Year 10 5.90 6.55 3.28 20-Year 3.750% 7.219 6.677 6.177 5.713 5.285 4.888 4.522 4.462 4.461 4.462 4.461 4.462 4.461 4.462 4.461 4.462 4.461 4.462 4.461 2.231 5.91 5.90 5.91 5.90 5.91 Year 11 Year 12 Year 13 Year 14 Year 15 Year 16 Year 17 Year 18 Year 19 Year 20 Year 21 2.95 TABLE 2a MACRS Mid-Quarter Convention: For property placed in service during the first quarter Depreciation Rate for Recovery Period 5-Year 7-Year Year 1 35.00% 25.00% Year 2 26.00 21.43 Year 3 15.60 15.31 Year 4 11.01 10.93 Year 5 11.01 8.75 Year 6 1.38 8.74 Year 7 8.75 Year 8 1.09 TABLE 26 MACRS Mid-Quarter Convention: For property placed in service during the second quarter Depreciation Rate for Recovery Period 5-Year 7-Year Year 1 25.00% 17.85% Year 2 30.00 23.47 Year 3 18.00 16.76 Year 4 11.37 11.97 Year 5 11.37 8.87 Year 6 4.26 8.87 Year 7 8.87 Year 8 3.34 TABLE 2c MACRS Mid-Quarter Convention: For property placed in service during the third quarter Depreciation Rate for Recovery Period 5-Year 7-Year Year 1 15.00% 10.71% Year 2 34.00 25.51 Year 3 20.40 18.22 Year 4 12.24 13.02 Year 5 11.30 7.06 Year 6 Year 7 Year 8 9.30 8.85 8.86 5.53 TABLE 20 MACRS-Mid Quarter Convention: For property placed in service during the fourth quarter Depreciation Rate for Recovery Period 5-Year 7-Year Year 1 5.00% 3.57% Year 2 38.00 27.55 Year 3 22.80 19.68 Year 4 13.68 14.06 Year 5 10.94 10.04 Year 6 9.58 8.73 Year 7 8.73 Year 8 7.64 EXHIBIT 10-6 Mid-Quarter Convention Percentage of Full-Year's Depreciation in Year of Disposition Quarter of Disposition Percentage Calculation* 1 st 12.5% 1.5/12 2nd 37.5 4.5/12 3rd 62.5 7.5/12 4th 87.5 10.5/12 *The calculation is the number of months the taxpayer held or is deemed to have held the asset in the year of disposition divided by months in the year. Way Corporation disposed of the following tangible personal property assets in the current year. Asset Furniture (7-year) Machinery (7-year) Delivery truck* (5-year) Machinery (7-year) Computer (5-year) Date Acquired 5/12/17 3/23/18 9/17/19 10/11/20 10/11/21 Date Sold 7/15/21 3/15/21 3/13/21 8/26/21 12/15/21 Convention HY MO HY MO HY Original Basis $ 95,000 112,000 52,000 311,600 112,000 *Used 100 percent for business. Assume that the delivery truck is not a luxury auto. Calculate Way Corporation's 2021 depreciation deduction (ignore $179 expense and bonus depreciation for this problem). (Use MACRS Table 1, Table 2, and Exhibit 10-6 (Round your intermediate dollar calculations and final answer to the nearest whole dollar amount.) Depreciation deduction Table 1 MACRS Half-Year Convention Year 1 Year 2 Year 3 Depreciation Rate for Recovery Period 3-Year 5-Year 7-Year 10-Year 15-Year 33.33% 20.00% 14.29% 10.00% 5.00% 44.45 32.00 24.49 18.00 9.50 14.81 19.20 17.49 14.40 8.55 7.41 11.52 12.49 11.52 7.70 11.52 8.93 9.22 6.93 Year 4 Year 5 Year 6 5.76 8.92 6.23 8.93 7.37 6.55 6.55 Year 7 Year 8 5.90 4.46 5.90 6.56 5.91 Year 9 Year 10 5.90 6.55 3.28 20-Year 3.750% 7.219 6.677 6.177 5.713 5.285 4.888 4.522 4.462 4.461 4.462 4.461 4.462 4.461 4.462 4.461 4.462 4.461 4.462 4.461 2.231 5.91 5.90 5.91 5.90 5.91 Year 11 Year 12 Year 13 Year 14 Year 15 Year 16 Year 17 Year 18 Year 19 Year 20 Year 21 2.95 TABLE 2a MACRS Mid-Quarter Convention: For property placed in service during the first quarter Depreciation Rate for Recovery Period 5-Year 7-Year Year 1 35.00% 25.00% Year 2 26.00 21.43 Year 3 15.60 15.31 Year 4 11.01 10.93 Year 5 11.01 8.75 Year 6 1.38 8.74 Year 7 8.75 Year 8 1.09 TABLE 26 MACRS Mid-Quarter Convention: For property placed in service during the second quarter Depreciation Rate for Recovery Period 5-Year 7-Year Year 1 25.00% 17.85% Year 2 30.00 23.47 Year 3 18.00 16.76 Year 4 11.37 11.97 Year 5 11.37 8.87 Year 6 4.26 8.87 Year 7 8.87 Year 8 3.34 TABLE 2c MACRS Mid-Quarter Convention: For property placed in service during the third quarter Depreciation Rate for Recovery Period 5-Year 7-Year Year 1 15.00% 10.71% Year 2 34.00 25.51 Year 3 20.40 18.22 Year 4 12.24 13.02 Year 5 11.30 7.06 Year 6 Year 7 Year 8 9.30 8.85 8.86 5.53 TABLE 20 MACRS-Mid Quarter Convention: For property placed in service during the fourth quarter Depreciation Rate for Recovery Period 5-Year 7-Year Year 1 5.00% 3.57% Year 2 38.00 27.55 Year 3 22.80 19.68 Year 4 13.68 14.06 Year 5 10.94 10.04 Year 6 9.58 8.73 Year 7 8.73 Year 8 7.64 EXHIBIT 10-6 Mid-Quarter Convention Percentage of Full-Year's Depreciation in Year of Disposition Quarter of Disposition Percentage Calculation* 1 st 12.5% 1.5/12 2nd 37.5 4.5/12 3rd 62.5 7.5/12 4th 87.5 10.5/12 *The calculation is the number of months the taxpayer held or is deemed to have held the asset in the year of disposition divided by months in the year. Way Corporation disposed of the following tangible personal property assets in the current year. Asset Furniture (7-year) Machinery (7-year) Delivery truck* (5-year) Machinery (7-year) Computer (5-year) Date Acquired 5/12/17 3/23/18 9/17/19 10/11/20 10/11/21 Date Sold 7/15/21 3/15/21 3/13/21 8/26/21 12/15/21 Convention HY MO HY MO HY Original Basis $ 95,000 112,000 52,000 311,600 112,000 *Used 100 percent for business. Assume that the delivery truck is not a luxury auto. Calculate Way Corporation's 2021 depreciation deduction (ignore $179 expense and bonus depreciation for this problem). (Use MACRS Table 1, Table 2, and Exhibit 10-6 (Round your intermediate dollar calculations and final answer to the nearest whole dollar amount.) Depreciation deduction
Step by Step Solution
There are 3 Steps involved in it

Get step-by-step solutions from verified subject matter experts