

TABLE 1 PRESENT VALUE OF $1 11 5% 4% 0.952381 1 0.961538 0.907029 2 0.924556 0.863838...
Fantastic news! We've Found the answer you've been seeking!
Question:
Transcribed Image Text:
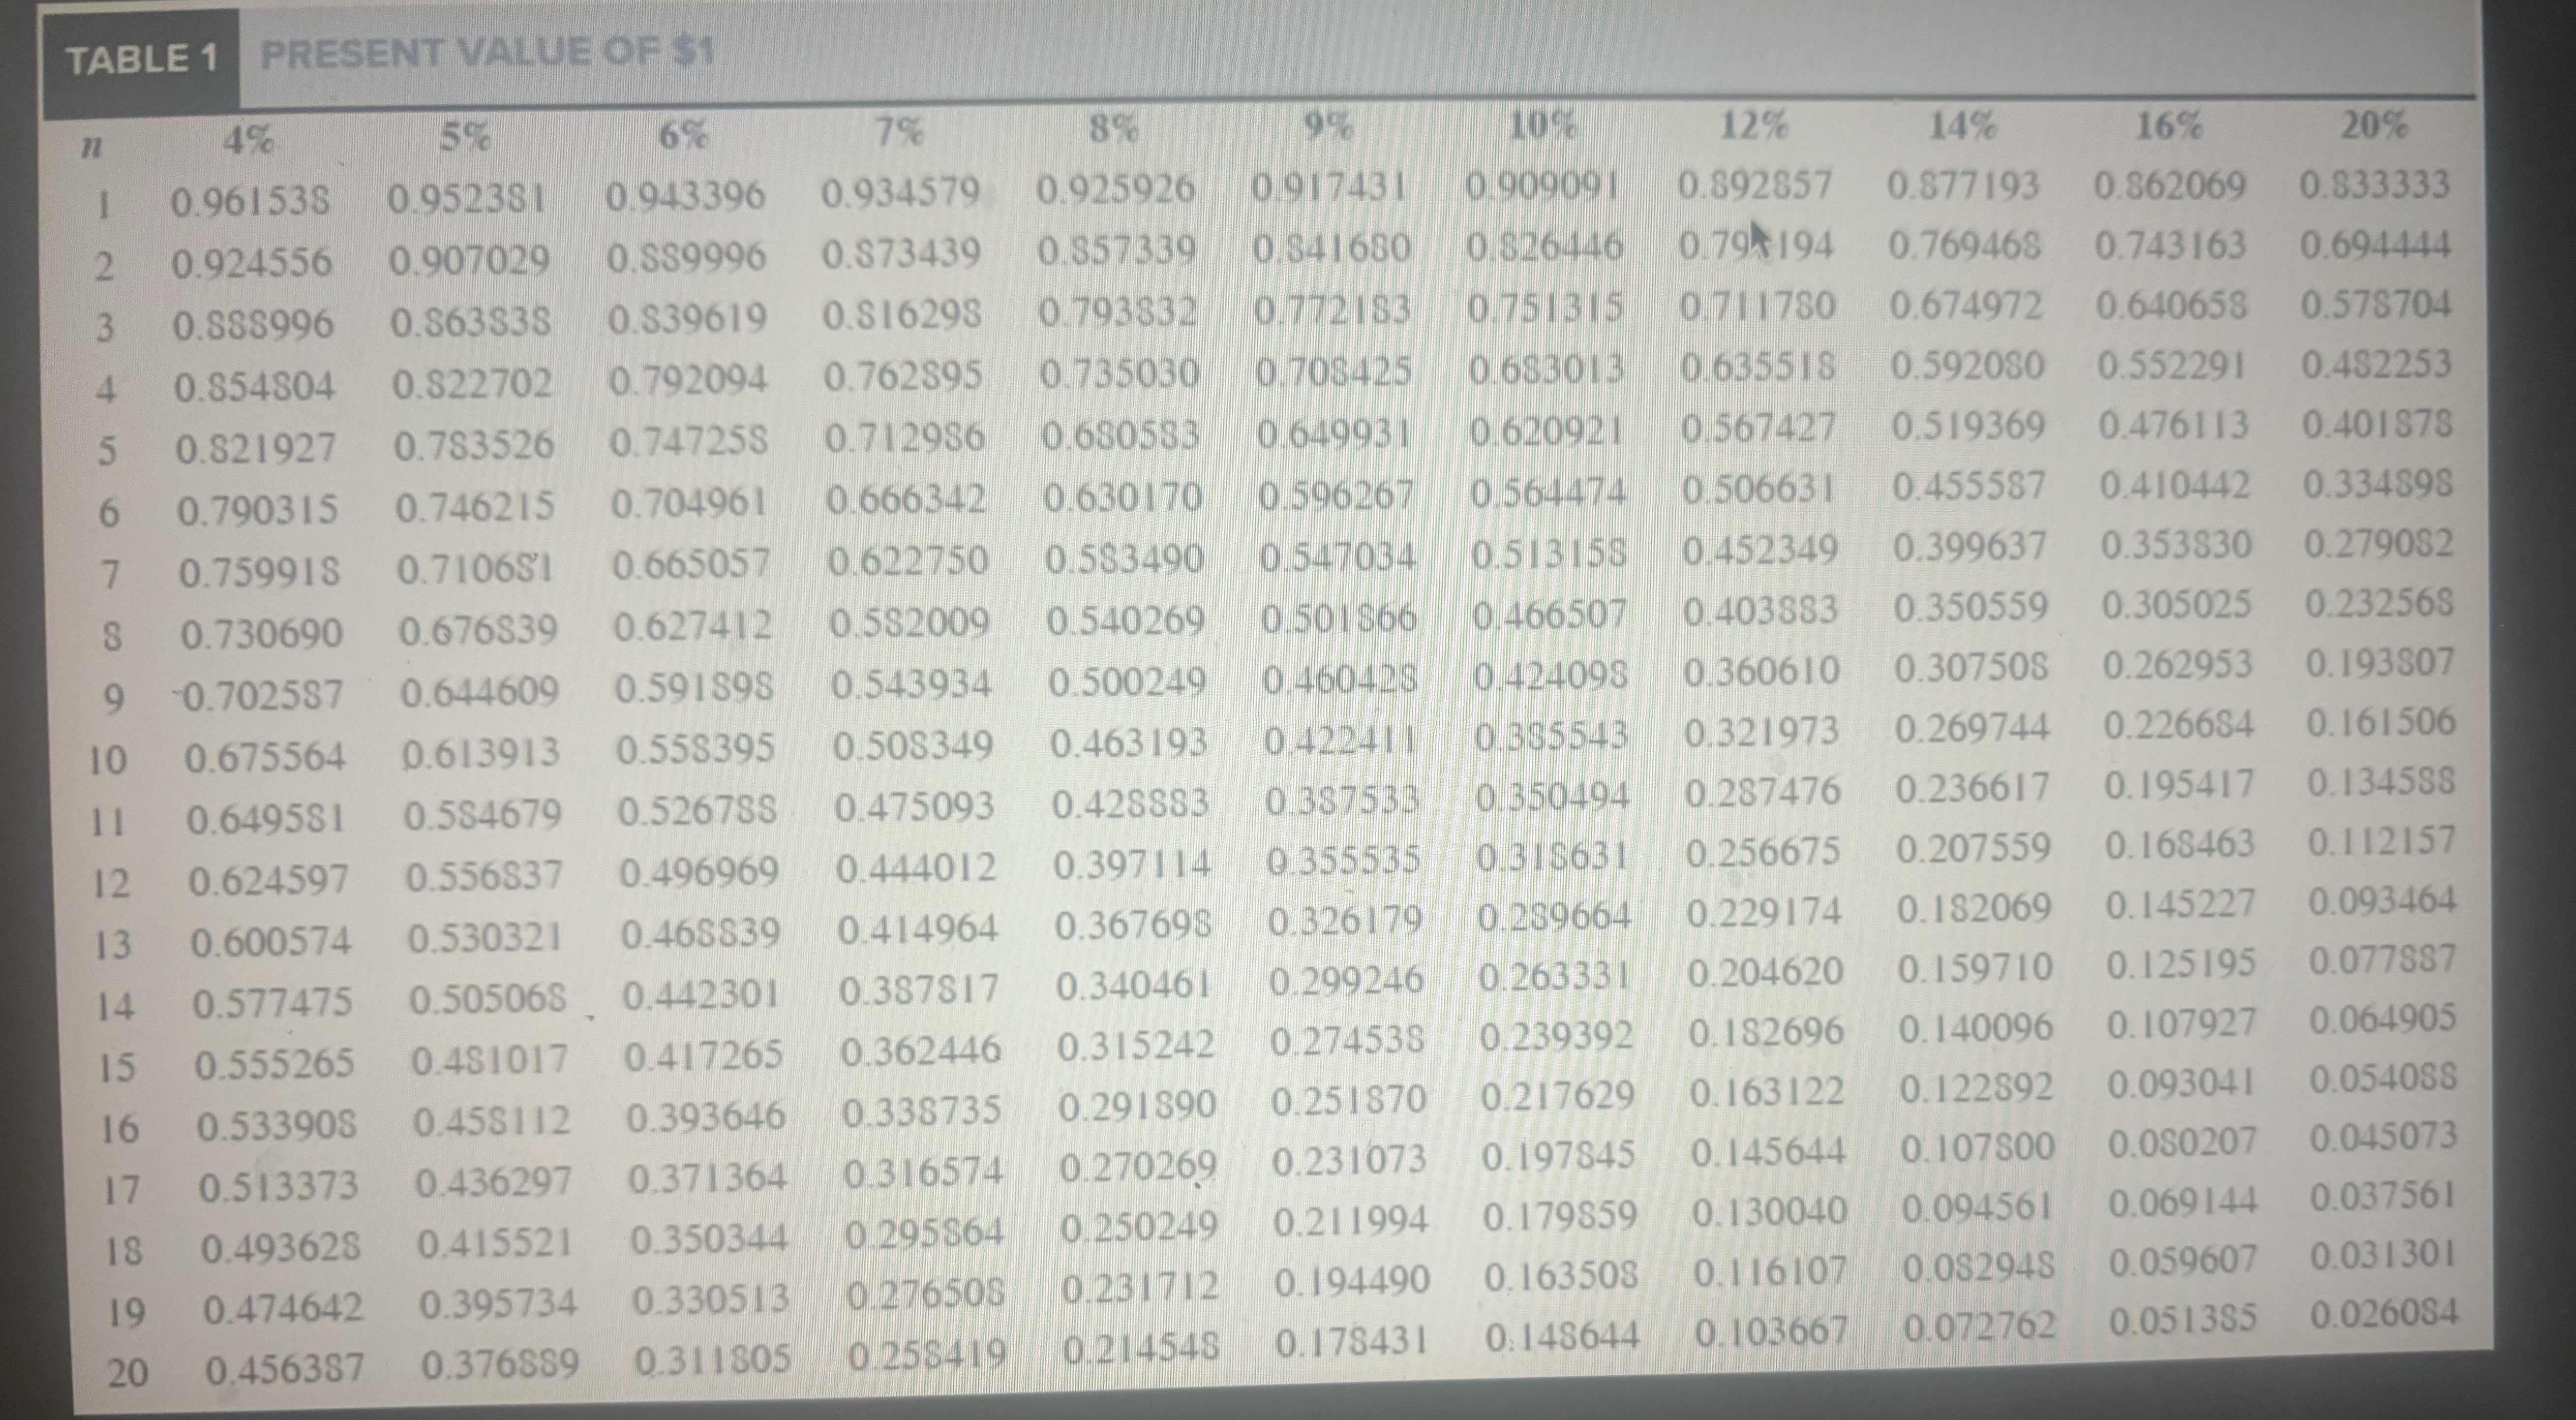
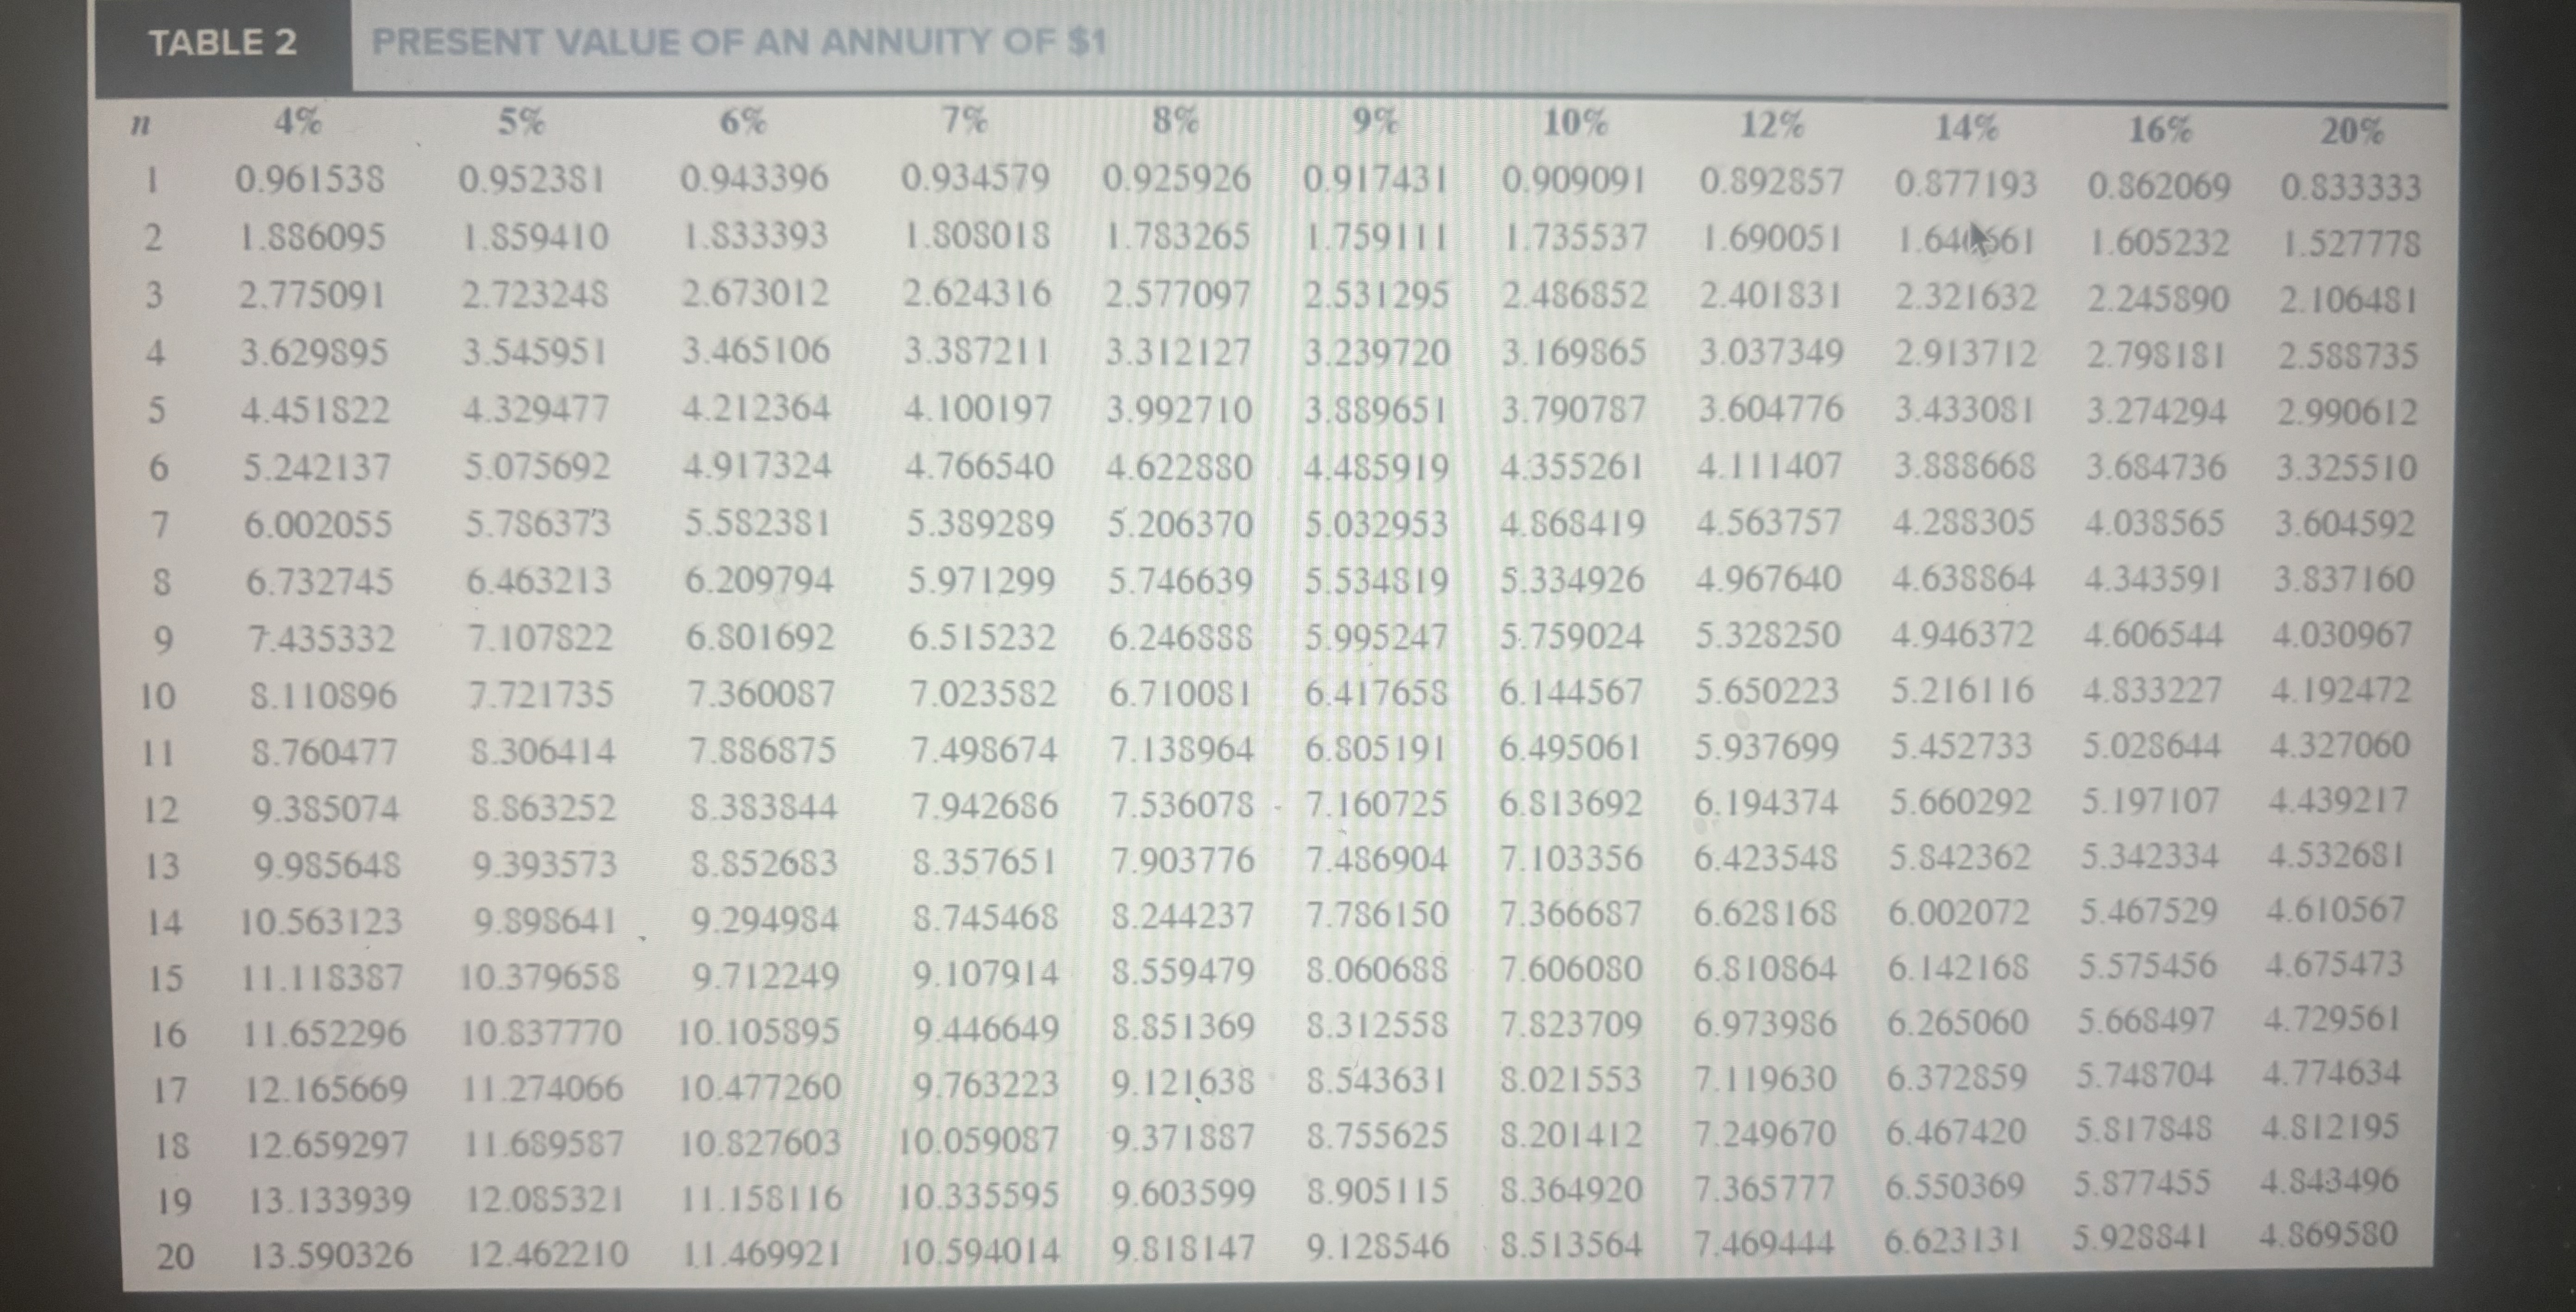
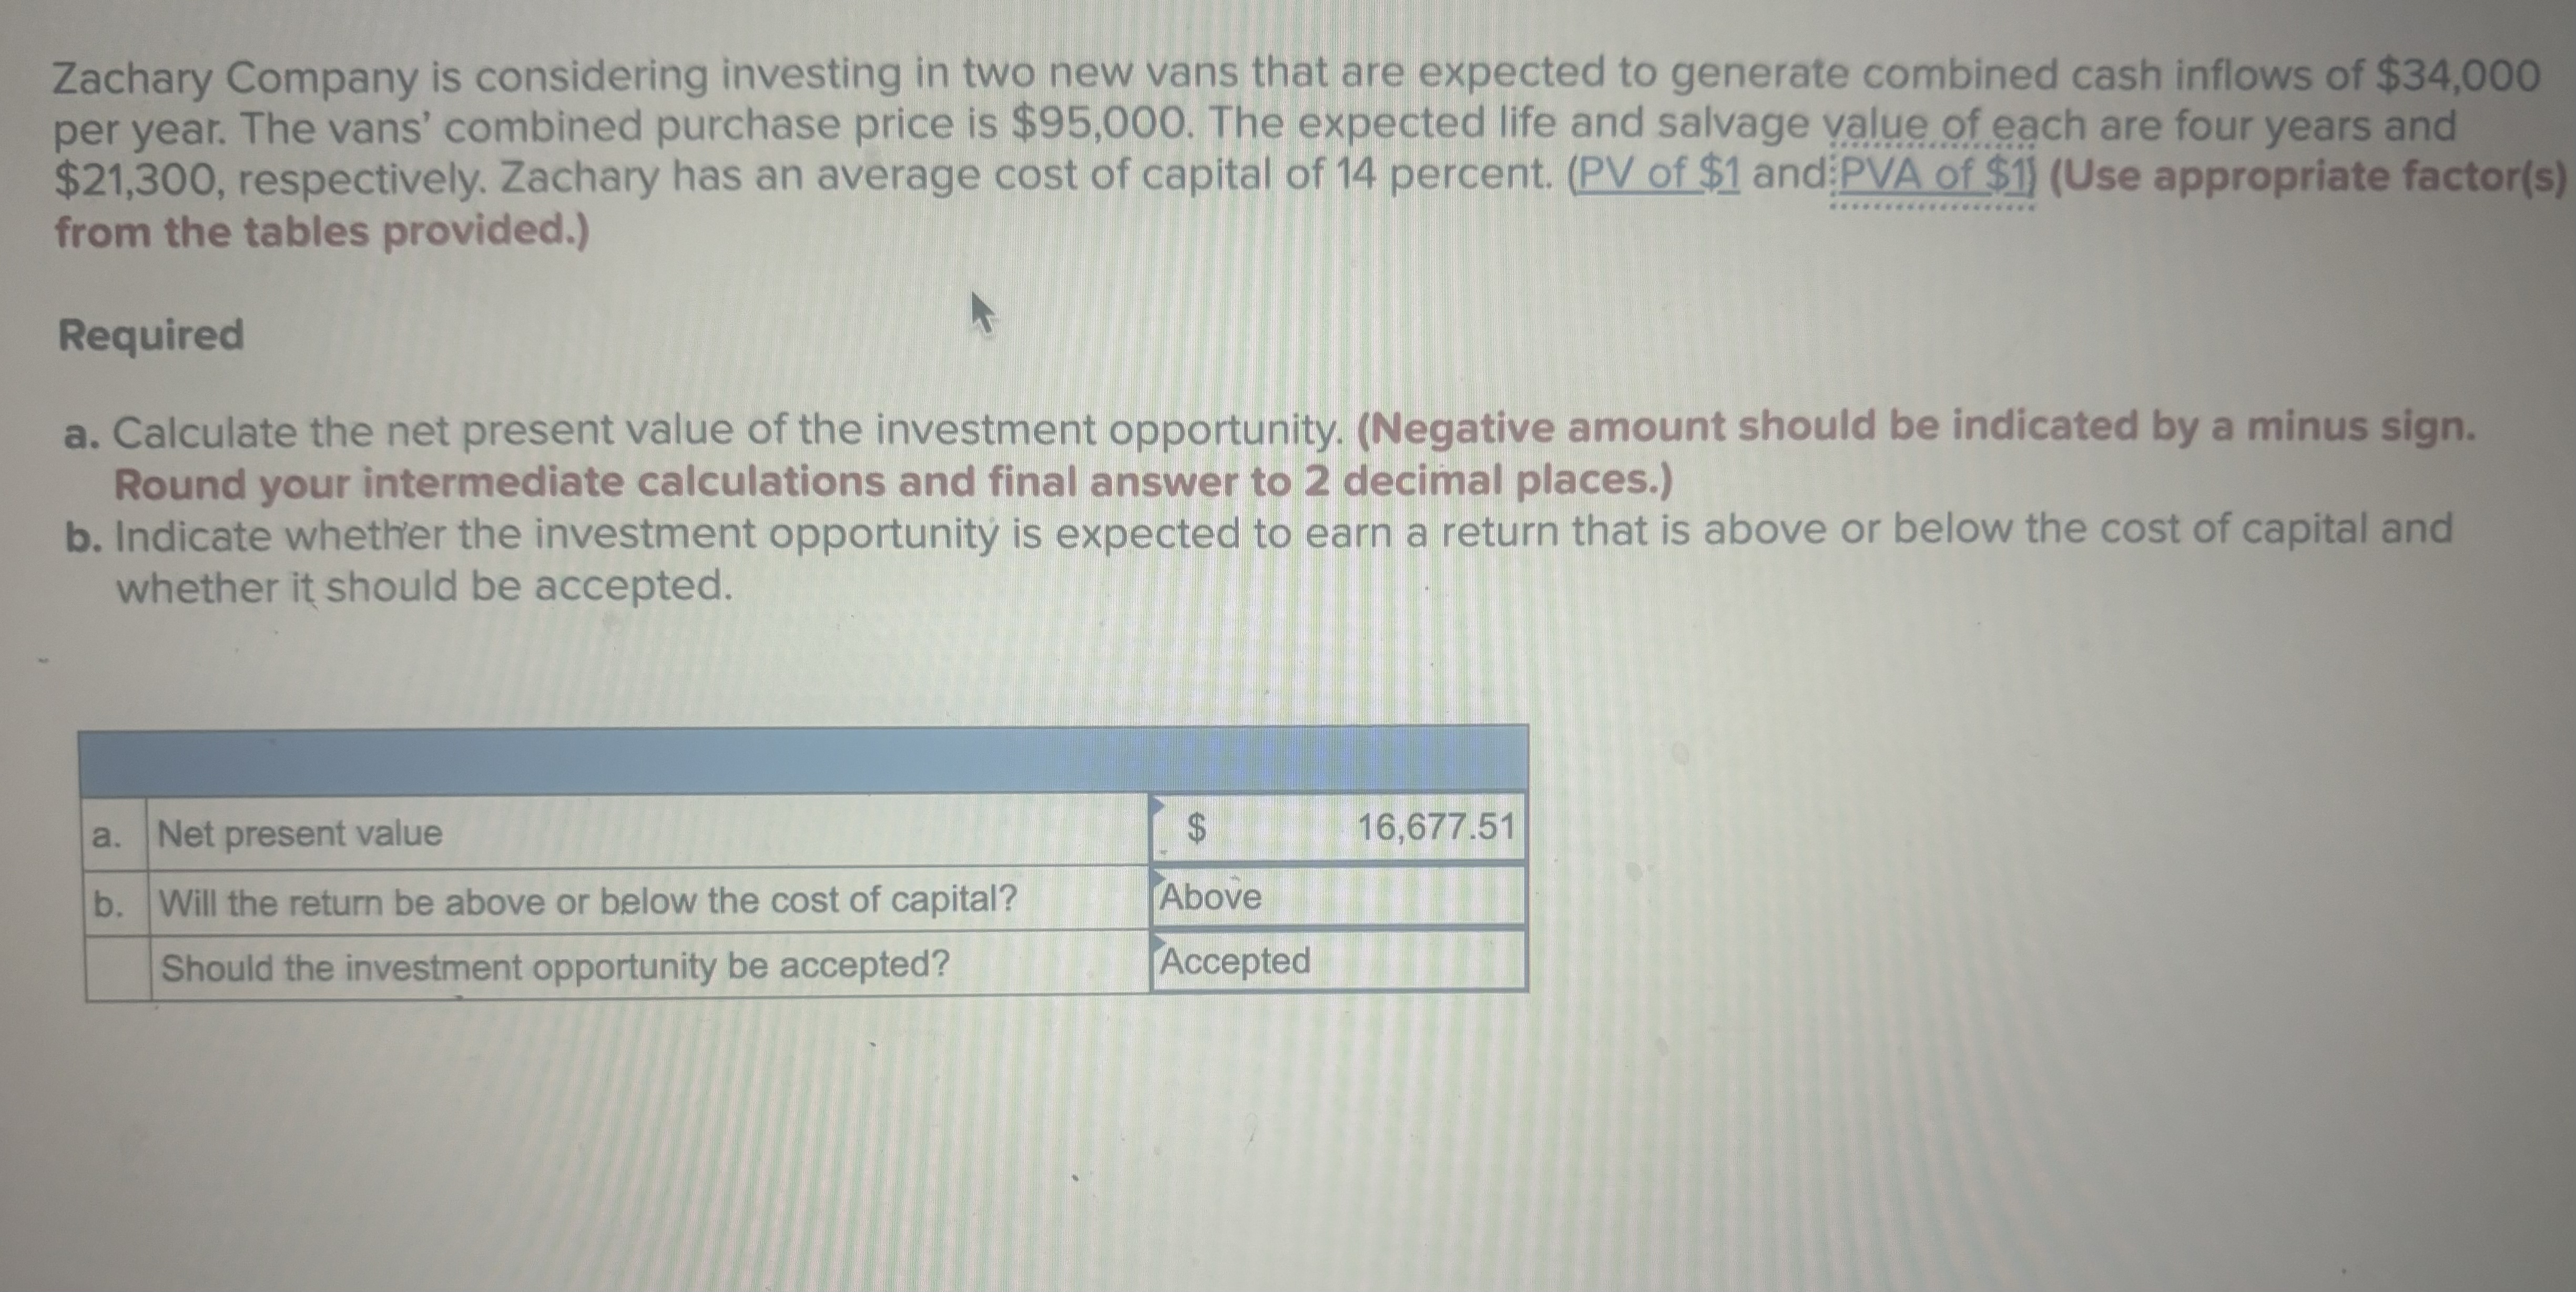
TABLE 1 PRESENT VALUE OF $1 11 5% 4% 0.952381 1 0.961538 0.907029 2 0.924556 0.863838 3 0.888996 4 0.854804 0.822702 6% 7% 0.943396 0.934579 0.889996 0.873439 0.839619 0.816298 5 0.792094 0.821927 0.783526 0.747258 6 0.790315 0.746215 0.762895 0.735030 0.712986 0.680583 0.704961 0.666342 0.630170 7 0.759918 0.710651 0.665057 0.622750 0.583490 8 0.730690 0.676839 9 -0.702587 0.644609 10 0.675564 0.613913 11 0.649581 0.584679 0.627412 0.582009 0.540269 0.591898 0.543934 0.500249 0.558395 0.508349 0.463193 0.526788 0.475093 12 0.624597 0.556837 0.496969 0.444012 8% 9% 10% 12% 14% 16% 20% 0.925926 0.917431 0.909091 0.892857 0.877193 0.862069 0.833333 0.857339 0.79 194 0.769468 0.743163 0.841680 0.826446 0.743163 0.694444 0.793832 0.711780 0.674972 0.640658 0.578704 0.772183 0.751315 0.708425 0.635518 0.683013 0.592080 0.552291 0.482253 0.649931 0.620921 0.567427 0.519369 0.476113 0.401878 0.596267 0.564474 0.506631 0.455587 0.410442 0.334898 0.547034 0.513158 0.452349 0.399637 0.353830 0.279082 0.501866 0.466507 0.350559 0.305025 0.232568 0.403883 0.460428 0.307508 0.262953 0.193807 0.424098 0.360610 0.269744 0.226684 0.161506 0.422411 0.385543 0.321973 0.428883 0.236617 0.195417 0.134588 0.387533 0.350494 0.287476 0.397114 0.318631 0.256675 0.207559 0.168463 0.112157 0.355535 0.367698 0.414964 0.326179 0.239664 0.229174 0.182069 0.145227 0.093464 13 0.600574 0.530321 0.468839 0.299246 0.263331 0.387817 0.340461 0.204620 0.159710 0.125195 0.077887 14 0.577475 0.505068 0.442301 0.315242 0.274538 0.239392 0.182696 0.140096 0.107927 0.064905 0.362446 15 0.555265 0.481017 0.417265 0.163122 0.251870 0.217629 0.122892 0.093041 0.054088 0.338735 0.393646 0.291890 16 0.533908 0.458112 0.107800 0.080207 0.045073 0.231073 0.197845 0.145644 0.270269 0.316574 0.436297 0.371364 17 0.513373 0.069144 0.037561 0.211994 0.179859 0.130040 0.094561 0.295864 0.250249 18 0.493628 0.415521 0.350344 0.082948 0.059607 0.031301 0.194490 0.163508 0.276508 0.231712 19 0.474642 0.395734 0.330513 0.178431 0:148644 20 0.456387 0.376889 0.311805 0.258419 0.214548 0.116107 0.103667 0.072762 0.051385 0.026084 TABLE 2 PRESENT VALUE OF AN ANNUITY OF $1 11 4% 5% 1 0.961538 0.952381 2 1.886095 1.859410 3 2.775091 2.723248 4 3.629895 3.545951 5 6 8 9 10 11 6% 7% 8% 9% 10% 12% 0.943396 0.934579 0.925926 0.917431 0.909091 0.892857 1.833393 1.808018 1.783265 1.759111 1.735537 1.690051 2.673012 2.624316 2.577097 2.531295 2.486852 2.401831 3.465106 3.387211 3.312127 3.239720 3.169865 3.037349 4.451822 4.329477 4.212364 5.242137 5.075692 4.917324 7 6.002055 5.786373 5.582381 6.732745 6.463213 6.209794 7.435332 7.107822 6.801692 8.110896 7.721735 7.360087 8.760477 8.306414 7.886875 12 9.385074 8.863252 8.383844 13 9.985648 9.393573 8.852683 14 10.563123 9.898641 9.294984 15 11.118387 10.379658 9.712249 16 11.652296 10.837770 10.105895 17 12.165669 11.274066 10.477260 18 12.659297 11.689587 10.827603 19 13.133939 12.085321 11.158116 20 13.590326 12.462210 1.1.469921 14% 0.877193 16% 20% 0.862069 0.833333 1.640 561 1.605232 1.527778 2.245890 2.106481 2.913712 2.798181 2.588735 4.100197 3.992710 3.889651 3.790787 3.604776 3.433081 3.274294 2.990612 4.766540 4.622880 4.485919 4.355261 4.111407 3.888668 3.684736 3.325510 5.389289 5.206370 5.032953 4.868419 4.563757 4.288305 4.038565 3.604592 5.971299 5.746639 5.534819 5.334926 4.967640 4.638864 4.343591 3.837160 6.515232 6.246888 5.995247 5.759024 5.328250 4.946372 4.606544 4.030967 7.023582 6.710081 6.417658 6.144567 5.650223 5.216116 4.833227 4.192472 7.498674 7.138964 6.805191 6.495061 5.937699 5.452733 5.028644 4.327060 7.942686 7.536078 7.160725 6.813692 6.194374 5.660292 5.197107 4.439217 8.357651 7.903776 7.486904 7.103356 6.423548 5.842362 5.342334 4.532681 8.745468 8.244237 7.786150 7.366687 6.628168 6.002072 5.467529 4.610567 9.107914 8.559479 8.060688 7.606080 6.810864 6.142168 5.575456 4.675473 9.446649 8.851369 8.312558 7.823709 6.973986 6.265060 5.668497 4.729561 9.763223 9.121638 8.543631 8.021553 7.119630 6.372859 5.748704 4.774634 10.059087 9.371887 8.755625 8.201412 7.249670 6.467420 5.817848 4.812195 10.335595 9.603599 8.905115 8.364920 7.365777 6.550369 5.877455 4.843496 10.594014 9.818147 9.128546 6.623131 5.928841 4.869580 8.513564 7.469444 2.321632 ****** Zachary Company is considering investing in two new vans that are expected to generate combined cash inflows of $34,000 per year. The vans' combined purchase price is $95,000. The expected life and salvage value of each are four years and $21,300, respectively. Zachary has an average cost of capital of 14 percent. (PV of $1 and PVA of $1) (Use appropriate factor(s) from the tables provided.) Required a. Calculate the net present value of the investment opportunity. (Negative amount should be indicated by a minus sign. Round your intermediate calculations and final answer to 2 decimal places.) b. Indicate whether the investment opportunity is expected to earn a return that is above or below the cost of capital and whether it should be accepted. a. Net present value $ 16,677.51 b. Will the return be above or below the cost of capital? Should the investment opportunity be accepted? Above Accepted TABLE 1 PRESENT VALUE OF $1 11 5% 4% 0.952381 1 0.961538 0.907029 2 0.924556 0.863838 3 0.888996 4 0.854804 0.822702 6% 7% 0.943396 0.934579 0.889996 0.873439 0.839619 0.816298 5 0.792094 0.821927 0.783526 0.747258 6 0.790315 0.746215 0.762895 0.735030 0.712986 0.680583 0.704961 0.666342 0.630170 7 0.759918 0.710651 0.665057 0.622750 0.583490 8 0.730690 0.676839 9 -0.702587 0.644609 10 0.675564 0.613913 11 0.649581 0.584679 0.627412 0.582009 0.540269 0.591898 0.543934 0.500249 0.558395 0.508349 0.463193 0.526788 0.475093 12 0.624597 0.556837 0.496969 0.444012 8% 9% 10% 12% 14% 16% 20% 0.925926 0.917431 0.909091 0.892857 0.877193 0.862069 0.833333 0.857339 0.79 194 0.769468 0.743163 0.841680 0.826446 0.743163 0.694444 0.793832 0.711780 0.674972 0.640658 0.578704 0.772183 0.751315 0.708425 0.635518 0.683013 0.592080 0.552291 0.482253 0.649931 0.620921 0.567427 0.519369 0.476113 0.401878 0.596267 0.564474 0.506631 0.455587 0.410442 0.334898 0.547034 0.513158 0.452349 0.399637 0.353830 0.279082 0.501866 0.466507 0.350559 0.305025 0.232568 0.403883 0.460428 0.307508 0.262953 0.193807 0.424098 0.360610 0.269744 0.226684 0.161506 0.422411 0.385543 0.321973 0.428883 0.236617 0.195417 0.134588 0.387533 0.350494 0.287476 0.397114 0.318631 0.256675 0.207559 0.168463 0.112157 0.355535 0.367698 0.414964 0.326179 0.239664 0.229174 0.182069 0.145227 0.093464 13 0.600574 0.530321 0.468839 0.299246 0.263331 0.387817 0.340461 0.204620 0.159710 0.125195 0.077887 14 0.577475 0.505068 0.442301 0.315242 0.274538 0.239392 0.182696 0.140096 0.107927 0.064905 0.362446 15 0.555265 0.481017 0.417265 0.163122 0.251870 0.217629 0.122892 0.093041 0.054088 0.338735 0.393646 0.291890 16 0.533908 0.458112 0.107800 0.080207 0.045073 0.231073 0.197845 0.145644 0.270269 0.316574 0.436297 0.371364 17 0.513373 0.069144 0.037561 0.211994 0.179859 0.130040 0.094561 0.295864 0.250249 18 0.493628 0.415521 0.350344 0.082948 0.059607 0.031301 0.194490 0.163508 0.276508 0.231712 19 0.474642 0.395734 0.330513 0.178431 0:148644 20 0.456387 0.376889 0.311805 0.258419 0.214548 0.116107 0.103667 0.072762 0.051385 0.026084 TABLE 2 PRESENT VALUE OF AN ANNUITY OF $1 11 4% 5% 1 0.961538 0.952381 2 1.886095 1.859410 3 2.775091 2.723248 4 3.629895 3.545951 5 6 8 9 10 11 6% 7% 8% 9% 10% 12% 0.943396 0.934579 0.925926 0.917431 0.909091 0.892857 1.833393 1.808018 1.783265 1.759111 1.735537 1.690051 2.673012 2.624316 2.577097 2.531295 2.486852 2.401831 3.465106 3.387211 3.312127 3.239720 3.169865 3.037349 4.451822 4.329477 4.212364 5.242137 5.075692 4.917324 7 6.002055 5.786373 5.582381 6.732745 6.463213 6.209794 7.435332 7.107822 6.801692 8.110896 7.721735 7.360087 8.760477 8.306414 7.886875 12 9.385074 8.863252 8.383844 13 9.985648 9.393573 8.852683 14 10.563123 9.898641 9.294984 15 11.118387 10.379658 9.712249 16 11.652296 10.837770 10.105895 17 12.165669 11.274066 10.477260 18 12.659297 11.689587 10.827603 19 13.133939 12.085321 11.158116 20 13.590326 12.462210 1.1.469921 14% 0.877193 16% 20% 0.862069 0.833333 1.640 561 1.605232 1.527778 2.245890 2.106481 2.913712 2.798181 2.588735 4.100197 3.992710 3.889651 3.790787 3.604776 3.433081 3.274294 2.990612 4.766540 4.622880 4.485919 4.355261 4.111407 3.888668 3.684736 3.325510 5.389289 5.206370 5.032953 4.868419 4.563757 4.288305 4.038565 3.604592 5.971299 5.746639 5.534819 5.334926 4.967640 4.638864 4.343591 3.837160 6.515232 6.246888 5.995247 5.759024 5.328250 4.946372 4.606544 4.030967 7.023582 6.710081 6.417658 6.144567 5.650223 5.216116 4.833227 4.192472 7.498674 7.138964 6.805191 6.495061 5.937699 5.452733 5.028644 4.327060 7.942686 7.536078 7.160725 6.813692 6.194374 5.660292 5.197107 4.439217 8.357651 7.903776 7.486904 7.103356 6.423548 5.842362 5.342334 4.532681 8.745468 8.244237 7.786150 7.366687 6.628168 6.002072 5.467529 4.610567 9.107914 8.559479 8.060688 7.606080 6.810864 6.142168 5.575456 4.675473 9.446649 8.851369 8.312558 7.823709 6.973986 6.265060 5.668497 4.729561 9.763223 9.121638 8.543631 8.021553 7.119630 6.372859 5.748704 4.774634 10.059087 9.371887 8.755625 8.201412 7.249670 6.467420 5.817848 4.812195 10.335595 9.603599 8.905115 8.364920 7.365777 6.550369 5.877455 4.843496 10.594014 9.818147 9.128546 6.623131 5.928841 4.869580 8.513564 7.469444 2.321632 ****** Zachary Company is considering investing in two new vans that are expected to generate combined cash inflows of $34,000 per year. The vans' combined purchase price is $95,000. The expected life and salvage value of each are four years and $21,300, respectively. Zachary has an average cost of capital of 14 percent. (PV of $1 and PVA of $1) (Use appropriate factor(s) from the tables provided.) Required a. Calculate the net present value of the investment opportunity. (Negative amount should be indicated by a minus sign. Round your intermediate calculations and final answer to 2 decimal places.) b. Indicate whether the investment opportunity is expected to earn a return that is above or below the cost of capital and whether it should be accepted. a. Net present value $ 16,677.51 b. Will the return be above or below the cost of capital? Should the investment opportunity be accepted? Above Accepted
Expert Answer:

Related Book For 
Fundamentals of Corporate Finance
ISBN: 978-0133400694
1st canadian edition
Authors: Jonathan Berk, Peter DeMarzo, Jarrad Harford, David A. Stangeland, Andras Marosi
Posted Date:
Students also viewed these finance questions
-
Canadians who visit the United States often buy liquor and cigarettes, which are much cheaper in the United States. However, there are limitations. Canadians visiting in the United States for more...
-
The data are reproduced shown below. Recall that simple linear regression was used to model number (y) of software millionaire birthdays in a decade as a straight-line function of number (x) of CEO...
-
When making this update, how is the row being updated mapped to the information on the web page? Figure 11.1 shows the initial display of WarningRecords in the database when the browser is first...
-
Football Comm LLC is a manufacturer of devices for football coaches and their coaching staffs that enable them to quickly and effectively communicate with one another during a game through a wireless...
-
Prove the identities in (3.82) and (3.83).
-
Solve, giving your answers correct to 3 significant figures. a. ln x = 5 b. ln x = 4 c. ln(x 2) = 6 d. ln(2x + 1) = 2
-
10.A company contracted with a marketing firm to construct software and create a business website. A quote was requested and accepted. Sometime later, the business asked for updates and revisions but...
-
Special Order Louisville Corporation produces baseball bats for kids that it sells for $32 each. At capacity, the company can produce 50,000 bats a year. The costs of producing and selling 50,000...
-
Connect each yearly salary to the correct paycheck payment. A. $55,000 B. $60,000 C. $26,000 D. $129,000 E. $56,000 OS $500 weekly $5,000 monthly $2,333 semi-monthly $4,961 biweekly $4,583 monthly
-
Cost Accounting for Decision Support: Step 1: Cost Identification and Allocation In cost accounting for decision support, the first step involves identifying and allocating costs associated with...
-
What do we mean by economic growth? Why do economies grow? In principle, what are the main implications of such growth for the environment?
-
List the three main problem areas of contingent valuation as you see it; and explain how researchers could try to minimize the impacts of these problems on estimates of environmental benefits that...
-
Distinguish between the scale effect and the composition effect of trade liberalization.
-
Is a zero-risk society possible?
-
How do tradable pollution permits work in theory and in practice?
-
Debate whether Congress should repeal the Digital Millennium Copyright Acts anticircumvention provisions.
-
Planning: Creating an Audience Profile; Collaboration: Team Projects. Compare the Facebook pages of three companies in the same industry. Analyze the content on all available tabs. What can you...
-
Debate: Survey feedback can be a problematic OD technique because it permits people who are affected by organizational policies to generate data that speak against those policies.
-
What qualities would the ideal gatekeeper possess to facilitate the communication of technical information in the firm?
-
Suppose a job enrichment effort in one plant of a manufacturing firm is judged to be very successful. You are the corporate change agent responsible for the project, and you wish to diffuse it to...

Study smarter with the SolutionInn App