

Question: Table 1 presents the activity data for a construction project. Based on the information in this table: (a) Construct a network precedence diagram (b) Determine
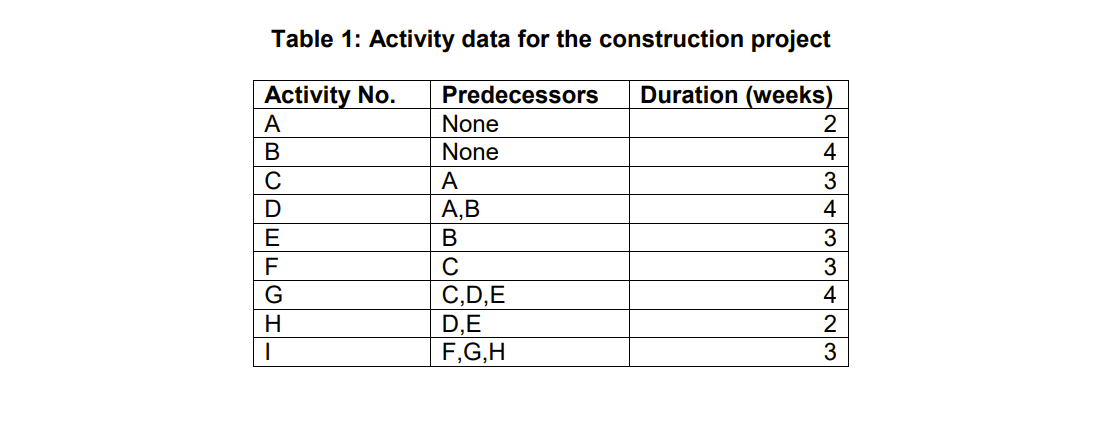
Table 1 presents the activity data for a construction project. Based on the information in this table: (a) Construct a network precedence diagram (b) Determine earliest and latest times for all activities and calculate activity floats. (c) Clearly identify the critical path(s) on the network diagram. (d) Explain what will happen to the project if ? activity F is delayed by 4 weeks; ? activity G is delayed by 3 weeks.
Step by Step Solution
There are 3 Steps involved in it
1 Expert Approved Answer
Step: 1 Unlock

Question Has Been Solved by an Expert!
Get step-by-step solutions from verified subject matter experts
Step: 2 Unlock
Step: 3 Unlock