

Question: Table 1 provides information about three securities which are part of the S&P500 index: Table 1 Security i Hi Pairs (i, j) ij Apple
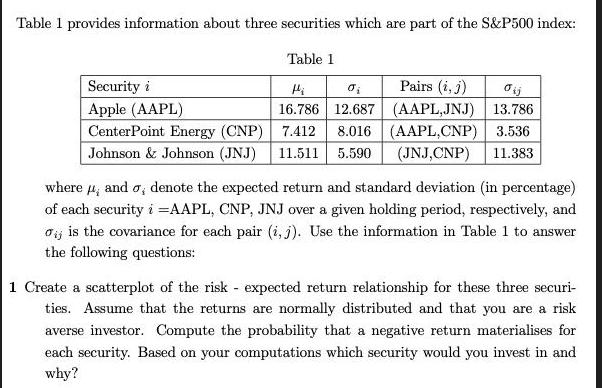
Table 1 provides information about three securities which are part of the S&P500 index: Table 1 Security i Hi Pairs (i, j) ij Apple (AAPL) 16.786 12.687 (AAPL,JNJ) 13.786 CenterPoint Energy (CNP) Johnson & Johnson (JNJ) 7.412 8.016 (AAPL,CNP) 3.536 11.511 5.590 (JNJ,CNP) 11.383 where, and , denote the expected return and standard deviation (in percentage) of each security i =AAPL, CNP, JNJ over a given holding period, respectively, and ij is the covariance for each pair (i, j). Use the information in Table 1 to answer the following questions: 1 Create a scatterplot of the risk expected return relationship for these three securi- ties. Assume that the returns are normally distributed and that you are a risk averse investor. Compute the probability that a negative return materialises for each security. Based on your computations which security would you invest in and why?
Step by Step Solution
There are 3 Steps involved in it

Get step-by-step solutions from verified subject matter experts