

Question: Table 1, queuing theory (before) shows that RN utilization was 56% at the time of day 0100. Explain how the utilization was calculated (what values
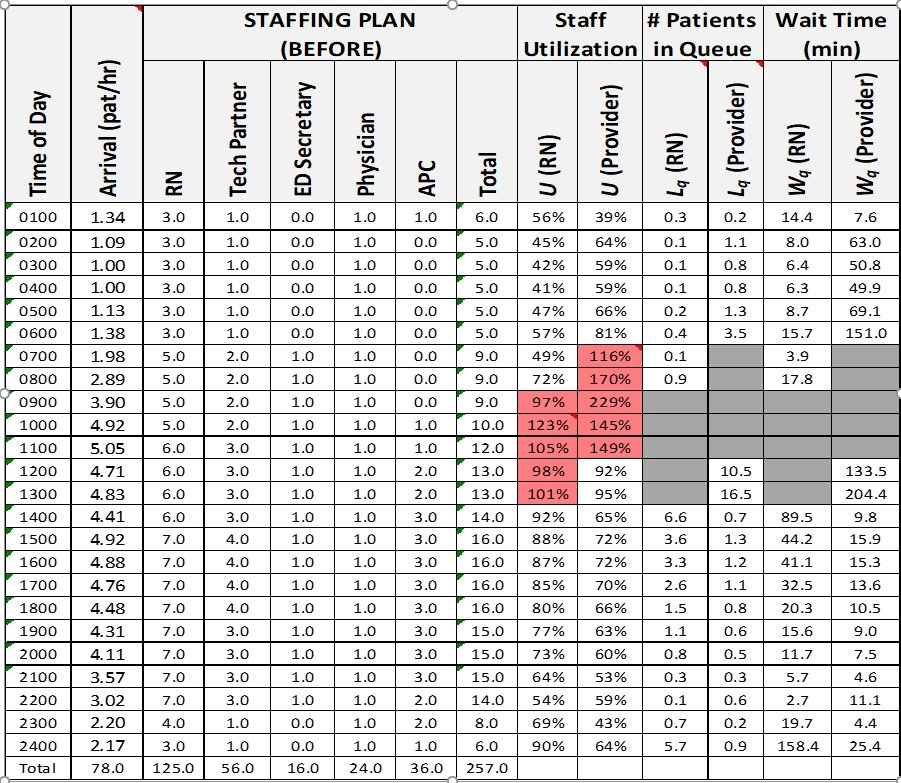
- Table 1, queuing theory (before) shows that RN utilization was 56% at the time of day 0100. Explain how the utilization was calculated (what values were used for a, p, m)?
- Table 1: at the time 0700, the physician wait time was not calculated. Why do you think that is?
STAFFING PLAN (BEFORE) Staff # Patients Wait Time Utilization in Queue (min) Time of Day Arrival (pat/hr) Tech Partner ED Secretary Physician U (Provider) La (Provider) RN) Wa (Provider) Lg (RN) Total W, (RN) 3.0 8 0.2 1. 1 0.8 0.8 1.3 3.5 7.6 63.0 50.8 49.9 69.1 151.0 0.3 0.1 0.1 0.1 0.2 0.4 0.1 0.9 0100 0200 0300 0400 0500 0600 0700 0800 1 0900 1000| 1100 | 1200 1300 1400 1500 1600 1700 1800 | 1900 2000 2100 2200 2300 2400 Total 1.0 1.0 1.0 1.0 1.0 1.0 1.0 1.0 1.0 1.0 1.0 1.0 1.0 14.4 .0 6.4 6.3 8.7 15.7 3.9 17.8 1.34 1.09 3.0 1.00 3.0 1.00 3.0 1.13 3 .0 1.38 3.0 1.98 5 .0 2.89 5.0 3.90 5.0 4.92 5.0 5.05 6.0 4.71 | 6.0 4.83 6.0 4.41 6.0 4.92 7.0 4.88 7.0 4.76 7.0 4.48 | 7.0 1 4.31 7.0 4.11 7.0 3.57 7 .0 3.02 7.0 2.20 4.0 2.17 3.0 78.0 125.0 1.0 1.0 1.0 1.0 1.0 1.0 2.0 2.0 2.0 2.0 3.0 3.0 3.0 3.0 4.0 4.0 4.0 4.0 3.0 3.0 3.0 3.0 1.0 1.0 56.0 1.0 0.0 0.0 0.0 0.0 0.0 0.0 0.0 0.0 1.0 1.0 2.0 2.0 0.0 0.0 0.0 0.0 0.0 0.0 1.0 1.0 1.0 1.0 1.0 1.0 1.0 1.0 1.0 1.0 1.0 1.0 1.0 1.0 1.0 1.0 0.0 0.0 16.0 6.0 5.0 5.0 5.0 5.0 5.0 9.0 9.0 9.0 10.0 12.0 | 13.0 13.0 / 56% | 45% 42% 41% 47% 57% 49% 72% 97% 123% 105% 98% 101% 39% 64% 59% 59% 66% 81% 116% 170% 229% 145% 149% 92% 95% 65% 72% 72% 70% 66% 63% 60% 53% 59% 43% 64% 10.5 16.5 133.5 204.4 14.0 92% 10.7 89.5 9.8 1.0 1.0 1.0 1.0 1.0 1.0 1.0 1.0 1.0 1.0 24.0 3.0 3.0 3.0 3.0 3.0 3.0 3.0 2.0 2.0 1.0 36.0 16.0 16.0 16.0 16.0 15.0 15.0 15.0 14.0 8.0 6.0 257.0 88% 87% 85% 80% 77% 73% 64% 54% 69% 90% 3.6 3.3 2.6 1.5 1.1 0.8 0.3 0.1 0.7 5.7 1. 3 1. 2 1.1 0.8 0.6 0.5 0.3 0.6 0.2 0.9 4 4.2 4 1.1 32.5 20.3 15.6 11.7 5.7 2.7 19.7 158.4 15.9 15.3 13.6 10.5 9.0 7.5 4.6 11.1 4.4 25.4 STAFFING PLAN (BEFORE) Staff # Patients Wait Time Utilization in Queue (min) Time of Day Arrival (pat/hr) Tech Partner ED Secretary Physician U (Provider) La (Provider) RN) Wa (Provider) Lg (RN) Total W, (RN) 3.0 8 0.2 1. 1 0.8 0.8 1.3 3.5 7.6 63.0 50.8 49.9 69.1 151.0 0.3 0.1 0.1 0.1 0.2 0.4 0.1 0.9 0100 0200 0300 0400 0500 0600 0700 0800 1 0900 1000| 1100 | 1200 1300 1400 1500 1600 1700 1800 | 1900 2000 2100 2200 2300 2400 Total 1.0 1.0 1.0 1.0 1.0 1.0 1.0 1.0 1.0 1.0 1.0 1.0 1.0 14.4 .0 6.4 6.3 8.7 15.7 3.9 17.8 1.34 1.09 3.0 1.00 3.0 1.00 3.0 1.13 3 .0 1.38 3.0 1.98 5 .0 2.89 5.0 3.90 5.0 4.92 5.0 5.05 6.0 4.71 | 6.0 4.83 6.0 4.41 6.0 4.92 7.0 4.88 7.0 4.76 7.0 4.48 | 7.0 1 4.31 7.0 4.11 7.0 3.57 7 .0 3.02 7.0 2.20 4.0 2.17 3.0 78.0 125.0 1.0 1.0 1.0 1.0 1.0 1.0 2.0 2.0 2.0 2.0 3.0 3.0 3.0 3.0 4.0 4.0 4.0 4.0 3.0 3.0 3.0 3.0 1.0 1.0 56.0 1.0 0.0 0.0 0.0 0.0 0.0 0.0 0.0 0.0 1.0 1.0 2.0 2.0 0.0 0.0 0.0 0.0 0.0 0.0 1.0 1.0 1.0 1.0 1.0 1.0 1.0 1.0 1.0 1.0 1.0 1.0 1.0 1.0 1.0 1.0 0.0 0.0 16.0 6.0 5.0 5.0 5.0 5.0 5.0 9.0 9.0 9.0 10.0 12.0 | 13.0 13.0 / 56% | 45% 42% 41% 47% 57% 49% 72% 97% 123% 105% 98% 101% 39% 64% 59% 59% 66% 81% 116% 170% 229% 145% 149% 92% 95% 65% 72% 72% 70% 66% 63% 60% 53% 59% 43% 64% 10.5 16.5 133.5 204.4 14.0 92% 10.7 89.5 9.8 1.0 1.0 1.0 1.0 1.0 1.0 1.0 1.0 1.0 1.0 24.0 3.0 3.0 3.0 3.0 3.0 3.0 3.0 2.0 2.0 1.0 36.0 16.0 16.0 16.0 16.0 15.0 15.0 15.0 14.0 8.0 6.0 257.0 88% 87% 85% 80% 77% 73% 64% 54% 69% 90% 3.6 3.3 2.6 1.5 1.1 0.8 0.3 0.1 0.7 5.7 1. 3 1. 2 1.1 0.8 0.6 0.5 0.3 0.6 0.2 0.9 4 4.2 4 1.1 32.5 20.3 15.6 11.7 5.7 2.7 19.7 158.4 15.9 15.3 13.6 10.5 9.0 7.5 4.6 11.1 4.4 25.4
Step by Step Solution
There are 3 Steps involved in it

Get step-by-step solutions from verified subject matter experts