

Question: Table 1: Riverbend Studios current year data Entertainment Revenues Fixed COGS Variable COGS # of customers $54,583,520 Streaming $30,184,570 Parks $7,564,270 $3,356,850 $4,074,530 $3,159,430
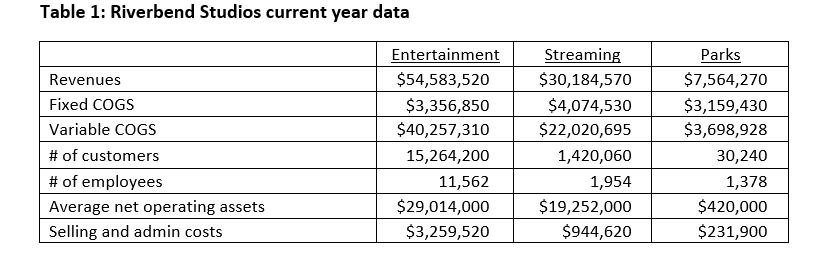
Table 1: Riverbend Studios current year data Entertainment Revenues Fixed COGS Variable COGS # of customers $54,583,520 Streaming $30,184,570 Parks $7,564,270 $3,356,850 $4,074,530 $3,159,430 $40,257,310 $22,020,695 $3,698,928 15,264,200 1,420,060 30,240 # of employees 11,562 Average net operating assets $29,014,000 1,954 $19,252,000 1,378 $420,000 Selling and admin costs $3,259,520 $944,620 $231,900
Step by Step Solution
There are 3 Steps involved in it
1 Expert Approved Answer
Step: 1 Unlock

Question Has Been Solved by an Expert!
Get step-by-step solutions from verified subject matter experts
Step: 2 Unlock
Step: 3 Unlock