

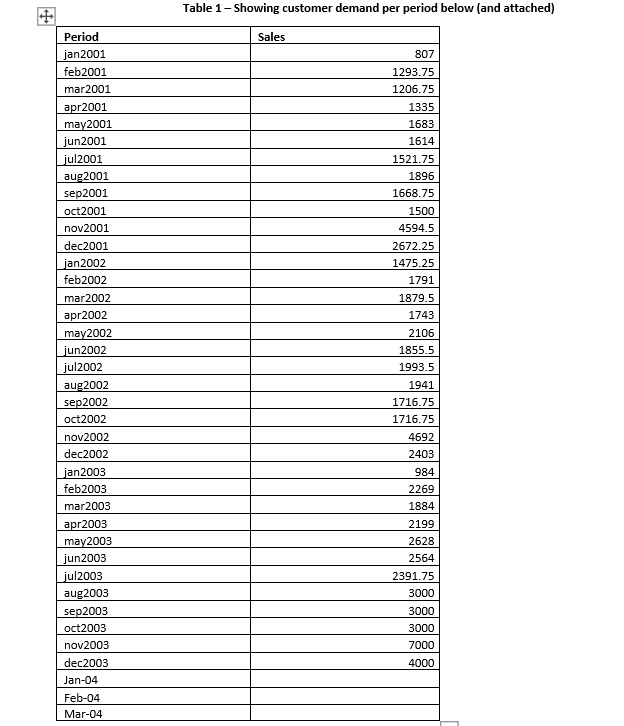
Question: Table 1 - Showing customer demand per period below ( and attached ) 1 . Using the data in Table 1 , calculate the Simple
Table Showing customer demand per period below and attached Using the data in Table calculate the Simple Moving Average months forecast for January, February, and March of
After determining and using the values for Janunderlineunderlinetext Mar calculate the seasonality index for February month from the data.
Step by Step Solution
There are 3 Steps involved in it
1 Expert Approved Answer
Step: 1 Unlock

Question Has Been Solved by an Expert!
Get step-by-step solutions from verified subject matter experts
Step: 2 Unlock
Step: 3 Unlock