

Question: Table 1 shows cumulative average abnormal returns (CAARs) before and after the event months (which is month 0) and in two sub-periods(2000-2007 and 2008-2014). Can
Table 1 shows cumulative average abnormal returns (CAARs) before and after the event months (which is month 0) and in two sub-periods(2000-2007 and 2008-2014).
Can someone explain to me how to see why the data show that the efficient market hypothesis is being contradicted? As I understand it is based on an underreaction and overreaction to the market, but how can I interpret the table to see that the EMH is contradicted?
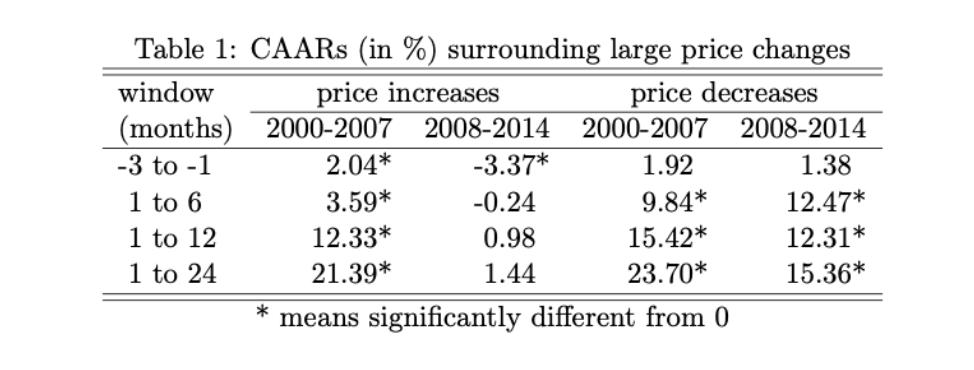
Table 1: CAARs (in %) surrounding large price changes window (months) -3 to -1 1 to 6 1 to 12 1 to 24 price increases 2000-2007 2.04* 3.59* 12.33* 21.39* price decreases 2008-2014 2000-2007 2008-2014 -3.37* -0.24 0.98 1.44 1.92 9.84* 15.42* 23.70* * means significantly different from 0 1.38 12.47* 12.31* 15.36*
Step by Step Solution
3.40 Rating (159 Votes )
There are 3 Steps involved in it
An important debate among investors is whether the stock market is efficientthat is whether it reflects all the information made available to market participants at any given time The efficient market ... View full answer

Get step-by-step solutions from verified subject matter experts