

Question: Table 1 shows measurement for 18 subgroups. Each subgroup has 3 different measurements from different samples. Subgroups number 4 reflects a new operator running the
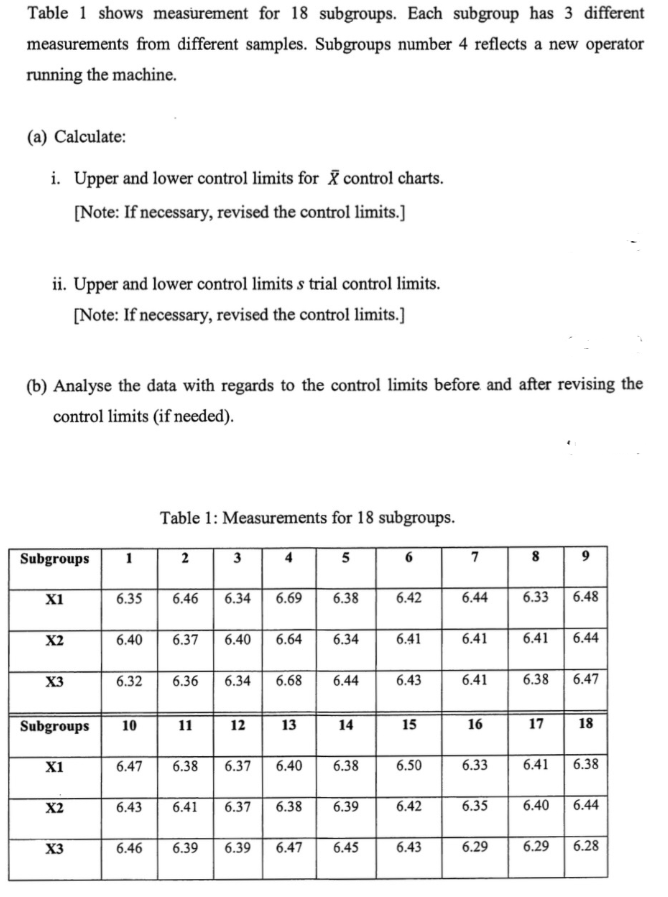
Table 1 shows measurement for 18 subgroups. Each subgroup has 3 different measurements from different samples. Subgroups number 4 reflects a new operator running the machine. (a) Calculate: i. Upper and lower control limits for X control charts. [Note: If necessary, revised the control limits.] ii. Upper and lower control limits s trial control limits. [Note: If necessary, revised the control limits.] (b) Analyse the data with regards to the control limits before and after revising the control limits (if needed). Table 1: Measurements for 18 subgroups. Table 1 shows measurement for 18 subgroups. Each subgroup has 3 different measurements from different samples. Subgroups number 4 reflects a new operator running the machine. (a) Calculate: i. Upper and lower control limits for X control charts. [Note: If necessary, revised the control limits.] ii. Upper and lower control limits s trial control limits. [Note: If necessary, revised the control limits.] (b) Analyse the data with regards to the control limits before and after revising the control limits (if needed). Table 1: Measurements for 18 subgroups
Step by Step Solution
There are 3 Steps involved in it

Get step-by-step solutions from verified subject matter experts