Question: Table 1 Table 2 H I A B D E F G 1 Chase Strategy Agg Plan 2020 2021 2022 2023 2024 2 (quantity in
Table 1
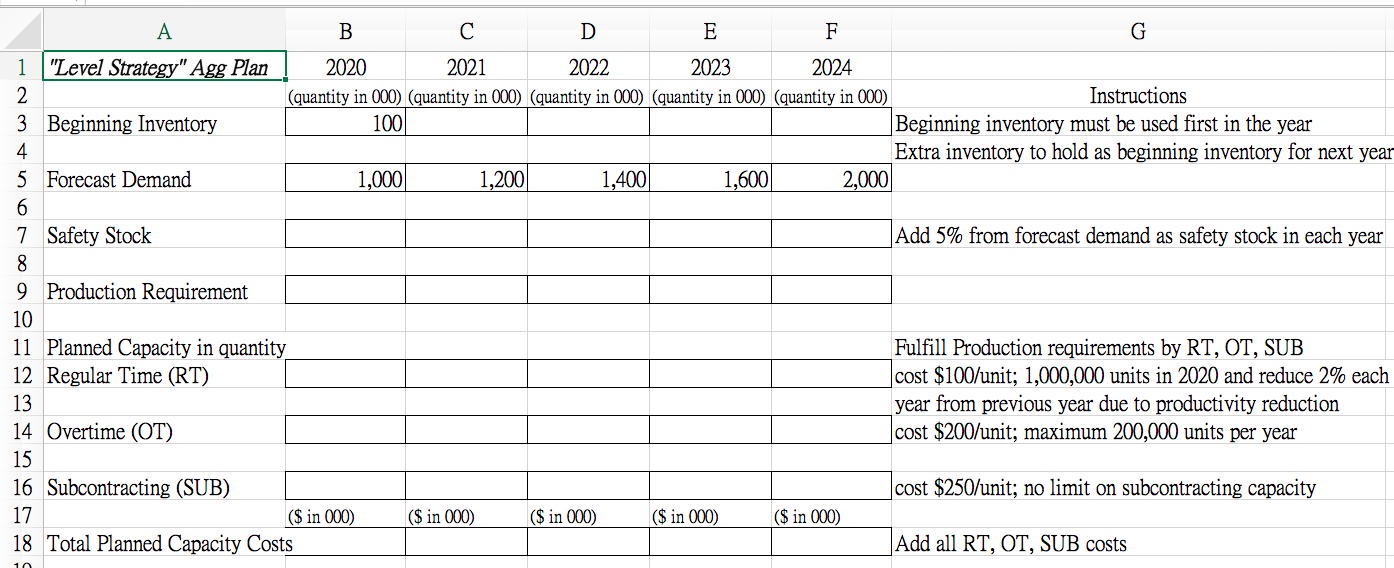
Table 2
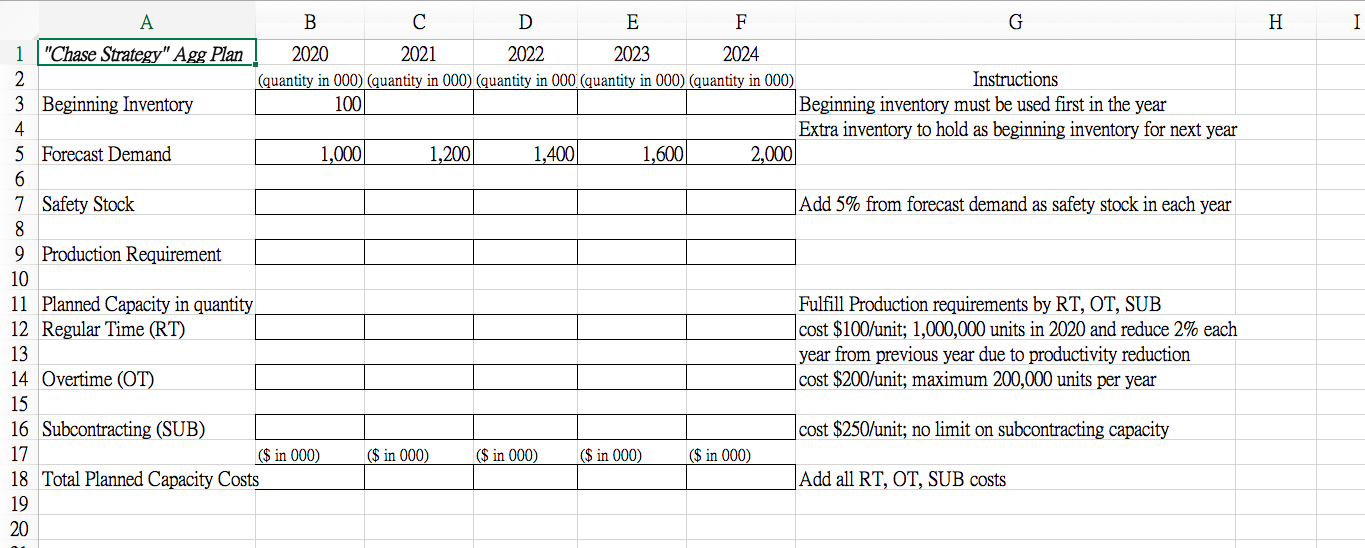
H I A B D E F G 1 "Chase Strategy" Agg Plan 2020 2021 2022 2023 2024 2 (quantity in 000) (quantity in 000) (quantity in 000 (quantity in 000) (quantity in 000) Instructions 3 Beginning Inventory 100 Beginning inventory must be used first in the year 4 Extra inventory to hold as beginning inventory for next year 5 Forecast Demand 1,000 1,200 1,400 1,600 2,000 6 7 Safety Stock Add 5% from forecast demand as safety stock in each year 8 9 Production Requirement 10 11 Planned Capacity in quantity Fulfill Production requirements by RT, OT, SUB 12 Regular Time (RT) cost $100/unit; 1,000,000 units in 2020 and reduce 2% each 13 year from previous year due to productivity reduction 14 Overtime (OT) cost $200/unit; maximum 200,000 units per year 15 16 Subcontracting (SUB) cost $250/unit; no limit on subcontracting capacity 17 ($ in 000) ($ in 000) ($ in 000) ($ in 000) ($ in 000) 18 Total Planned Capacity Costs Add all RT, OT, SUB costs 19 20 H I A B D E F G 1 "Chase Strategy" Agg Plan 2020 2021 2022 2023 2024 2 (quantity in 000) (quantity in 000) (quantity in 000 (quantity in 000) (quantity in 000) Instructions 3 Beginning Inventory 100 Beginning inventory must be used first in the year 4 Extra inventory to hold as beginning inventory for next year 5 Forecast Demand 1,000 1,200 1,400 1,600 2,000 6 7 Safety Stock Add 5% from forecast demand as safety stock in each year 8 9 Production Requirement 10 11 Planned Capacity in quantity Fulfill Production requirements by RT, OT, SUB 12 Regular Time (RT) cost $100/unit; 1,000,000 units in 2020 and reduce 2% each 13 year from previous year due to productivity reduction 14 Overtime (OT) cost $200/unit; maximum 200,000 units per year 15 16 Subcontracting (SUB) cost $250/unit; no limit on subcontracting capacity 17 ($ in 000) ($ in 000) ($ in 000) ($ in 000) ($ in 000) 18 Total Planned Capacity Costs Add all RT, OT, SUB costs 19 20


